From a graph of a function f(x) we can make a sketched graph of its derivative f ' (x). To do this, we use some things we talked about earlier.
- If f is decreasing, its slope (and hence its derivative) is negative. If f is increasing, its slope (and hence its derivative) is positive.
- From drawing tangent lines to f, we can compare relative values of the derivative and tell where the derivative is greatest.
- If f is a line, its slope is constant.
Be Careful: The word "it" is dangerous.
Look at these two sentences:
- It's increasing, so it's positive.
- f is increasing, so f ' is positive.
The first sentence is unclear. What does "it" mean? There's no way to know. Whenever we use the words "increasing, decreasing, positive, negative," that we are clear about what (f, f ', or something else?) is increasing, decreasing, positive, or negative.
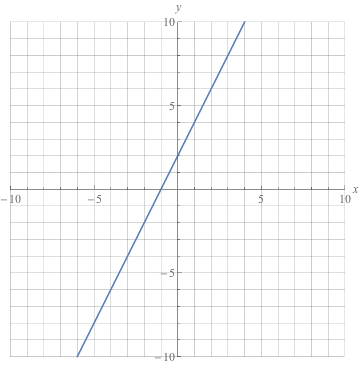
Practice:
From the graph of f(x), draw a graph of its derivative f'(x).
| |
Since f is a line, its slope is constant. Since f is sloping upward, its slope is a positive constant. This means f'(x) is a positive constant function: 
| |
From the graph of f(x), draw a graph of f'(x). 
| |
The slope of f starts out negative, gets closer to zero as we move right, and then settles at zero: 
This means f'(x) will start out negative, approach 0, and then remain at 0 from some point onwards: 
| |
From the graph of f(x), draw a graph of f'(x). 
| |
We can see that f starts out with a positive slope (derivative), then has a slope (derivative) of zero, then has a negative slope (derivative): 
This means the derivative will start out positive, approach 0, and then become negative: 
Be Careful: Label your graphs f or f' as appropriate. When we're graphing both functions and their derivatives, it can confusing to remember which graph we're looking at. | |
From the graph of f'(x), draw a graph of f(x). 
| |
Since f` is zero everywhere, the slope of f is zero everywhere, so f must be constant. f could be a positive constant: 
or zero: 
or a negative constant: 
As we can see from the previous example, we can't tell, given a graph of f', exactly what f will look like. We can only tell the general "shape" of f - that is, where f increases and where it decreases. | |
From the graph of f'(x), draw a graph of f(x). 
| |
f' is negative, then zero, then positive: 
This means f will be decreasing for a bit, and will then turn around and increase: 
| |
From the graph of f'(x), draw a graph of f(x). 
| |
First f' is negative, then positive, then zero: 
This means f will be decreasing, then zero, then increasing. | |
For the function f(x) below, draw a graph of f'(x). Don't worry too much about whether f' is straight or curvy - focus on getting it to cross the x axis in the right places.
Answer
- f has a constant, negative slope:

This means f' will be constant and negative:

For the function f(x) below, draw a graph of f'(x). Don't worry too much about whether f' is straight or curvy - focus on getting it to cross the x axis in the right places.
Answer
- f has a negative slope to the left of zero, a positive slope to the right of zero, and a slope of zero at zero:

This means its derivative will be negative to the left of zero, positive to the right of zero, and zero at zero:

For the function f(x) below, draw a graph of f'(x). Don't worry too much about whether f' is straight or curvy - focus on getting it to cross the x axis in the right places.
Answer
- f has a positive slope everywhere, except at zero where its slope is zero:

This means its derivative is always positive except at zero, where it is 0.
For the function f(x) below, draw a graph of f'(x). Don't worry too much about whether f' is straight or curvy - focus on getting it to cross the x axis in the right places.
Answer
- This function f is all confused. Its slope bounces all around between negative, positive, and zero. It's easiest to see what's going on by labeling the graph:

Respecting the sign of f' gets us this graph of f':
From the graph of f'(x), draw a graph of f(x). Make sure to label each graph.
Answer
- Wherever f' is positive, f will be increasing. Wherever f' is negative, f will be decreasing:
This means f will look something like one of these: 
Right now we don't have enough information to know which it would be.
From the graph of f'(x), draw a graph of f(x). Make sure to label each graph.
Answer
- f' is positive everywhere except 0:

This means f will be increasing everywhere except 0, so f will look something like this, possibly shifted up or down:

From the graph of f'(x), draw a graph of f(x). Make sure to label each graph.
Answer
- Wherever f' is positive, f will be increasing. Wherever f' is negative, f will be decreasing:

This means f will look something like this, possibly shifted up or down:

From the graph of f'(x), draw a graph of f(x). Make sure to label each graph.
Answer
- Here's f', labeled with what it's doing:

f' starts out as a positive constant, meaning f will start as a straight line with positive slope. Next f' gets closer to zero, therefore the slope of f gets shallower. Finally, f' becomes negative, meaning f will decrease: