We've already mentioned that series and integrals are much alike. The integral is the series' brother from another mother. Before we put on our x-ray glasses and take a closer look at convergence and divergence of series, we need to review and discuss two things: basic integral definitions, convergence, and divergence; and visualizing sequences and series.
Since we've already discussed everything we need to know about integrals, we've listed the important concepts here:
- weighted area, including left- and right-hand sums
- improper integrals with an infinite limit of integration
- what it means for such integrals to converge or diverge
- comparison of improper integrals
- the p-test for integral convergence
If you feel unsure about any of these, be sure to go review before we dive headfirst into the new stuff.
We already know we can visualize a sequence on a 2-D graph. We make the horizontal axis show which term we're on and the vertical axis show the value of that term.
Because they're sort of flat, we're going to use grilled cheese sandwiches to visualize series in 2-D.
First, we have a difficult question for you to answer; it's sure to confuse you for hours. What happens to the value of a number if you multiply it by 1?
The value of the number doesn't change. We sincerely hope you got that question right.
Sample Problem
What is the area of a grilled cheese sandwich with height an and width 1?
Answer.
The area of the sandwich looks like this:

Its area is
(height)(width) = an(1) = an.

 , is the area of a rectangle with height
  and width 1. Draw this rectangle on the interval [2, 3]:
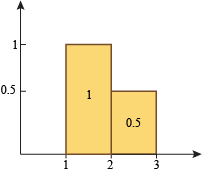


Exercise 1
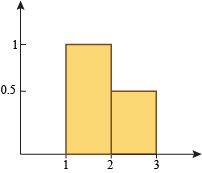
Find the area covered by the three grilled cheese sandwiches shown below.


Exercise 2
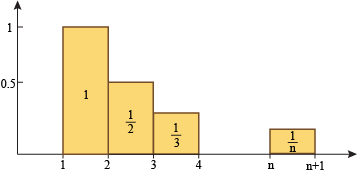
Visualize the harmonic series

on a 2-D graph.
Draw the rectangle for each term an on the interval [n – 1, n], so that we get a right-hand sum instead of a left-hand sum.

 , will fall on the interval [1, 2]:


Exercise 3
Draw 2-D graphs to visualize the series

using (a) a left-hand sum and (b) a right-hand sum.

