ShmoopTube
Where Monty Python meets your 10th grade teacher.
Search Thousands of Shmoop Videos
AP Statistics 1.2 Exploring Data 219 Views
Share It!
Description:
AP Statistics: Exploring Data Drill 1, Problem 2. Which of the following is the best way to display this type of data?
Transcript
- 00:00
Thank you We sneak shmoop be with it Yes We
- 00:06
would like to display the data we collected in a
- 00:07
survey that asked students what their favorite soft drink was
- 00:10
out of the following choices coke pepsi sprite and seven
- 00:14
up Which of the following is the best way to
Full Transcript
- 00:17
display this type of data And here the potential answers
- 00:21
Klaus wavering All right so we've collected a bunch of
- 00:25
data about soda preferences and we want to display it
- 00:29
So we'll be collecting the number of students who prefer
- 00:32
east soda So let's start by making up a few
- 00:35
numbers Since we love diet coke Here it come up
- 00:38
Let's do fifty four for coke forty nine for pepsi
- 00:41
thirty nine for sprite and twenty four seven up Now
- 00:44
let's determine the best plot to use well trust is
- 00:47
a stem and leaf plot Stemming Leave Plots are good
- 00:50
for displaying data for one category and many numbers But
- 00:54
we have four different categories of soda and only one
- 00:57
number per category So stem and leaf plot's really don't
- 01:00
work for us Our next choice is accumulative frequency hissed
- 01:03
a gram which is a graph that displays the running
- 01:06
Total of the frequencies for a specific category They we
- 01:10
wanted to display something like mass scores and how students
- 01:13
perform for different ranges of math scores accumulative frequency history
- 01:17
Graham would show these frequencies in a cumulative fashion which
- 01:20
means that instead of showing the individual frequencies they'll just
- 01:24
keep a running total of the frequencies so that the
- 01:26
bars increases You go to the right notice that this
- 01:28
works on lee for a specific category broken up into
- 01:31
more buckets Well we can't do that with the soda
- 01:34
data we collected We don't have that much numerical data
- 01:37
per soda type So accumulative frequency history crammed It really
- 01:40
doesn't work Alright Looking at choice senior a basic hissed
- 01:43
a gram Well any history ram displays on ly numeric
- 01:46
data there's no room for us to show the different
- 01:49
types of soda that rules out See he is a
- 01:52
bar graph A bar graph has different categories on one
- 01:56
axis and a new miracle value about those categories on
- 01:59
the other acts That's Exactly what we want we could
- 02:02
put up soda types is the category then show the
- 02:04
number of students who preferred the soda on the axis
- 02:10
All right our last choice is e dot plot dot
- 02:13
plots or similar to bar graphs and that they have
- 02:15
categories on one axis and the number of dots above
- 02:17
that category denotes the numerical data However counting dots would
- 02:21
become very difficult if many students were interviewed So d 00:02:25.33 --> [endTime] a bar graph is the best choice
Up Next
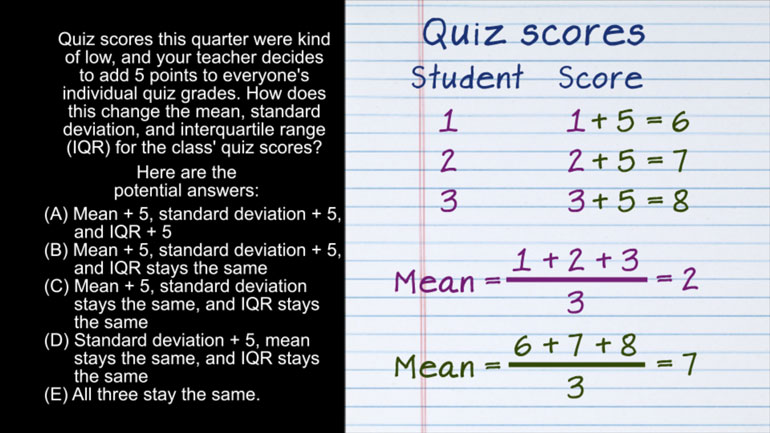
AP Statistics 2.1 Exploring Data. How does this change affect the mean, standard deviation, and IQR?
Related Videos
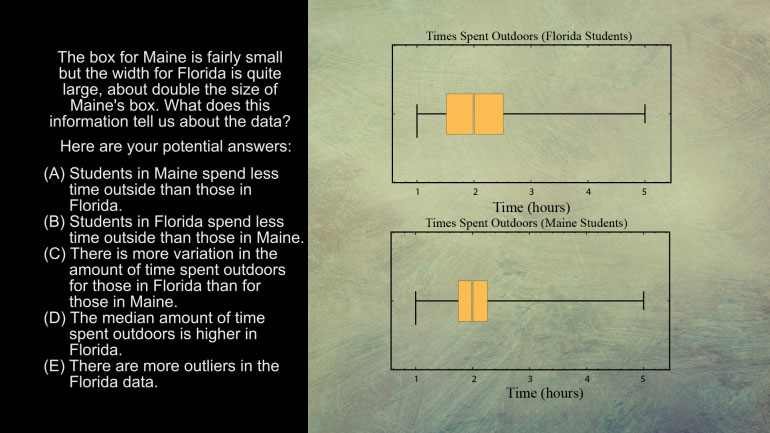
AP Statistics 5.1 Exploring Data. What does this information tell us about the data?
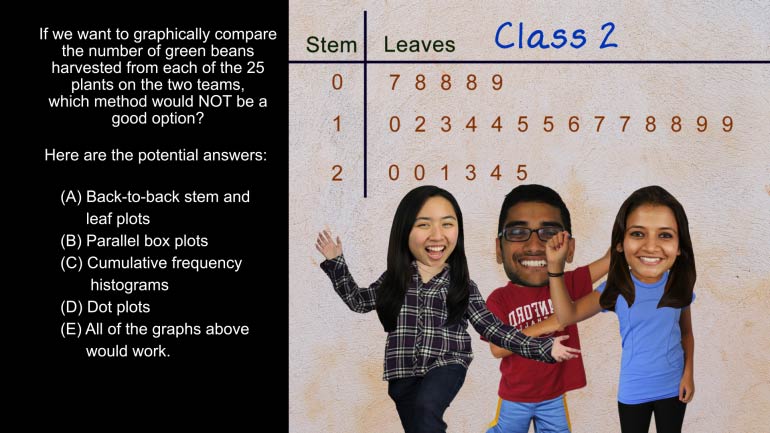
AP Statistics 5.2 Exploring Data. Which method would not be a good option?

AP Statistics 1.5 Statistical Inference. Which of the following statements is false?

Want to pull an Oliver Twist and ask us for more? We've gotcha covered. Head over to /video/subjects/math/test-prep/ap-statistics/ for more AP...