ShmoopTube
Where Monty Python meets your 10th grade teacher.
Search Thousands of Shmoop Videos
AP Statistics 4.3 Exploring Data 174 Views
Share It!
Description:
AP Statistics 4.3 Exploring Data. We would love it if our linear correlation coefficient were what?
Transcript
- 00:00
Thank you We sneak and here's your smoked You sure
- 00:05
Brought to you by the gym where you could burn
- 00:07
three hundred calories on the treadmill and then order a
- 00:10
four hundred calorie protein shake in the smoothie bar of
- 00:13
progress All right in a perfect world we would be
Full Transcript
- 00:16
able to do is little work as possible and still
- 00:18
get awesome results if we draw a scatter plot of
- 00:21
the relationship between the number of hours we spend at
- 00:23
the gym in our cardiovascular health we'd love it if
- 00:27
our linear correlation coefficient were what and hear the potential
- 00:32
answers All right here It would be nice if you
- 00:35
could totally understand all these concepts that watching a single
- 00:37
one of our videos Well sadly we don't live in
- 00:39
that world You're gonna have to put up with the
- 00:41
work It's okay though uh feels good when your brain
- 00:44
sweats Just be sure your wife down your skull all
- 00:47
right She was questions asking about linear correlation coefficient that
- 00:51
our stuff it wants to know what number we'd ideally
- 00:54
be looking for if we wantto barely break a sweat
- 00:58
while we're getting our ticker into tiptop shape But really
- 01:01
this is just about knowing what a linear correlation coefficient
- 01:04
tells us All right Well if it's a positive number
- 01:07
we need to know that there's a positive correlation and
- 01:10
if it's a negative number we should know that the
- 01:11
correlations negative so far so easy Well we want the
- 01:15
most game by putting in the least effort so we're
- 01:18
looking for a negative correlation So his showers options a
- 01:23
b and e it comes down to other r equals
- 01:25
negative one are our equals negative point three and we
- 01:29
can't really see how it could be the second one
- 01:31
Usually when dealing with perfect or ideal anything in mathematics
- 01:35
it's all or nothing it's gonna come out the one
- 01:37
zero or negative one and never seem totally random number
- 01:40
like negative point three plus the correlation coefficient of negative
- 01:44
point three isn't the most reliable things Sure sometimes that'll
- 01:47
work in our favor and less effort will lead to
- 01:49
better help But sometimes a data point oh jiggle away
- 01:51
from that perfect linear downward trend and we'd actually be
- 01:54
healthier if we exercise a little more so yeah no
- 01:57
thanks Anyway the answer is c honestly as good as
- 02:00
it sounds wouldn't we miss the sense of accomplishment that
- 02:03
comes from working hard in achieving our goals Wait trade
- 02:06
all that in for a second in an ice cream
Up Next
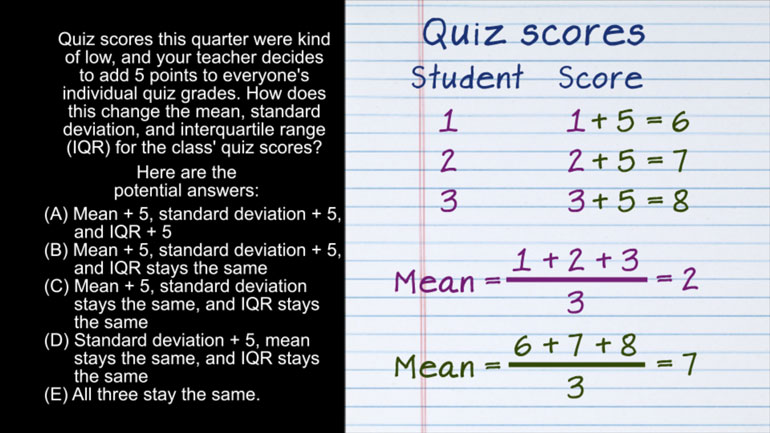
AP Statistics 2.1 Exploring Data. How does this change affect the mean, standard deviation, and IQR?
Related Videos
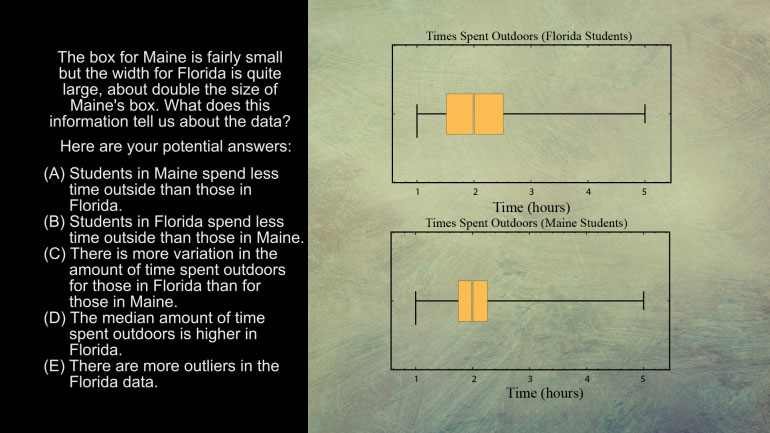
AP Statistics 5.1 Exploring Data. What does this information tell us about the data?
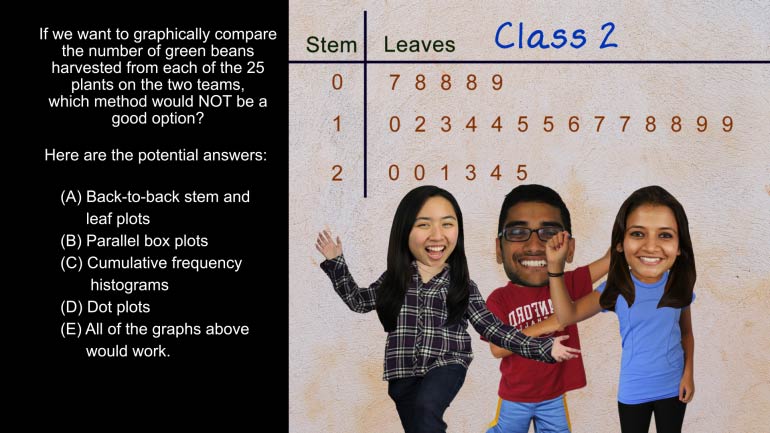
AP Statistics 5.2 Exploring Data. Which method would not be a good option?
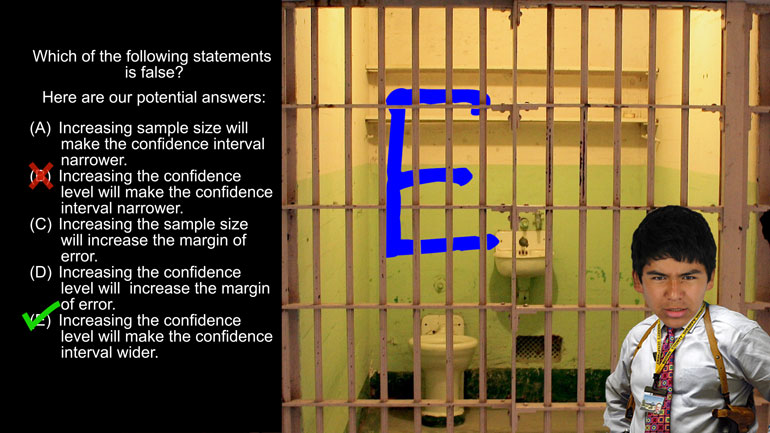
AP Statistics 1.5 Statistical Inference. Which of the following statements is false?
Want to pull an Oliver Twist and ask us for more? We've gotcha covered. Head over to /video/subjects/math/test-prep/ap-statistics/ for more AP...
