ShmoopTube
Where Monty Python meets your 10th grade teacher.
Search Thousands of Shmoop Videos
Statistics and Probability Videos 134 videos


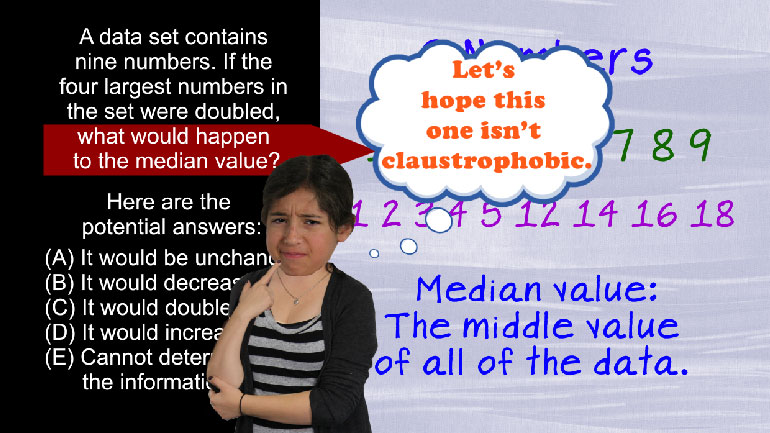
SAT Math: Statistics and Probability Drill 1, Problem 2. If the four largest numbers in the set were doubled, what would happen to the median...
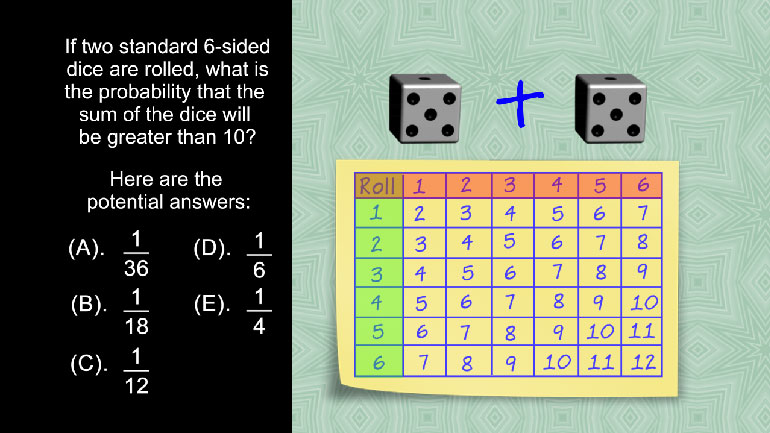
SAT Math 1.4 Statistics and Probability. If two standard 6-sided dice are rolled, what is the probability that the sum of the dice will be gre...

SAT Math 1.5 Statistics and Probability. If Silas draws one card, then places it in his pocket and draws another, what is the probability that...
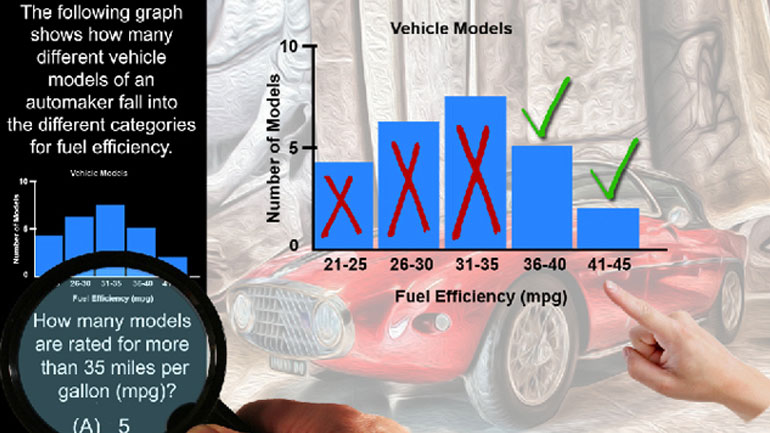
CAHSEE Math 3.1 Statistics, Data, and Probability II 170 Views
Share It!
Description:
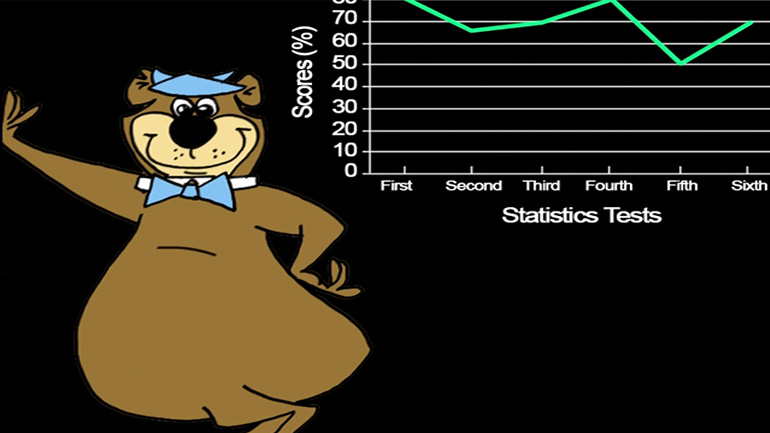
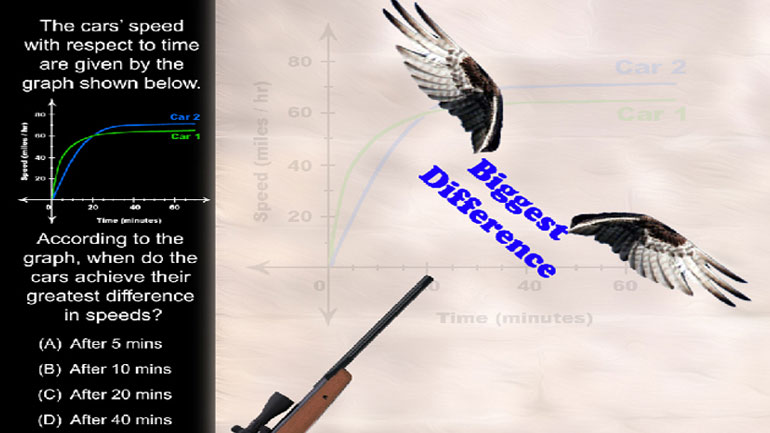
Statistics, Data, and Probability II Drill 3 Problem 1. According to the graph, when do the cars achieve their greatest difference in speeds?
Transcript
- 00:02
Here's your shmoop du jour...
- 00:04
Two cars, starting at the same place, took different routes to the same destination.
- 00:09
Their speeds with respect to time are given by the graph shown below.
- 00:13
According to the graph, when do the cars achieve their greatest difference in speeds?
- 00:19
And here are the potential answers:
Full Transcript
- 00:24
Can we read a line graph?
- 00:26
The question is asking for a DIFFERENCE in speed so
- 00:30
we know there’s a big fat subtraction problem coming.
- 00:33
We just have to know what we’re subtracting from what.
- 00:37
And we’re on the hunt for the biggest difference here… so where are the lines furthest apart?
- 00:43
…let’s just use the potential answer set to figure out the differences.
- 00:47
A says: After 5 minutes.
- 00:49
Well, if this is after 20 minutes… and half way back to t minus zero is here – that’ll
- 00:55
be the 10 minute mark and half way again puts us here at the 5 minute mark…
- 01:00
So… ok… we put our ruler here and draw a line straight up…
- 01:06
…and we intersect the blue line at about the 15 mile per hour mark and then don’t
- 01:11
hit green line car 1 until the 40 minute mark.
- 01:15
A difference of 25 miles an hour. OK, how about B? After 10 minutes, blue is
- 01:21
at about 37 miles an hour and green is about 50 miles an hour… so just about 13 miles
- 01:28
an hour difference there. A is still winning. C. Well, after 20 minutes they are about the
- 01:34
same speed so C doesn’t have a prayer. Let’s try D. Green is about 62 and blue
- 01:41
is about 70 – slow and steady wins the race, we guess…
- 01:45
…but we didn’t care WHO wins – all we care about for this problem is at what point
- 01:49
there is the greatest distance between the two cars.
- 01:53
It looks like the winner is answer A with 25 miles an hour difference after minute 5.
Related Videos

CAHSEE Math: Algebra and Functions Drill 5, Problem 3. Solve the equation.

Statistics, Data, and Probability I: Drill Set 1, Problem 1. What is the mean yearly salary?

Statistics, Data, and Probability I: Drill Set 1, Problem 2. What is the median length of these writing utensils?
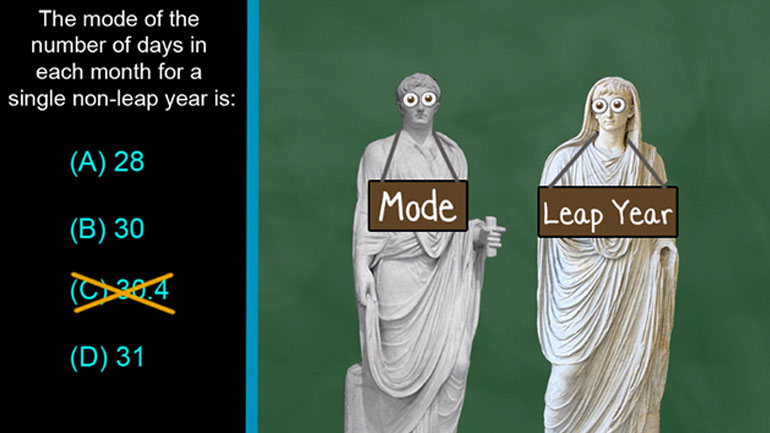
CAHSEE Math Statistics, Data, and Probability I: Drill Set 1, Problem 3. The mode of the number of days in each month for a single non-leap year is...

Statistics, Data, and Probability I: Drill Set 1, Problem 4. How old was the final person to join?