ShmoopTube
Where Monty Python meets your 10th grade teacher.
Search Thousands of Shmoop Videos
Statistics and Probability Videos 134 videos
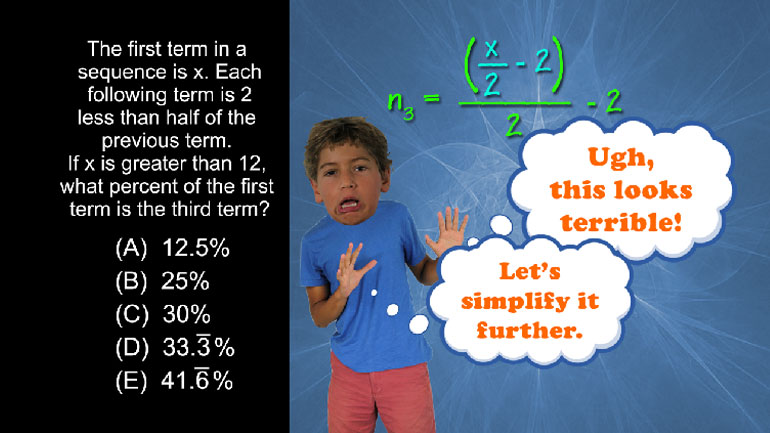


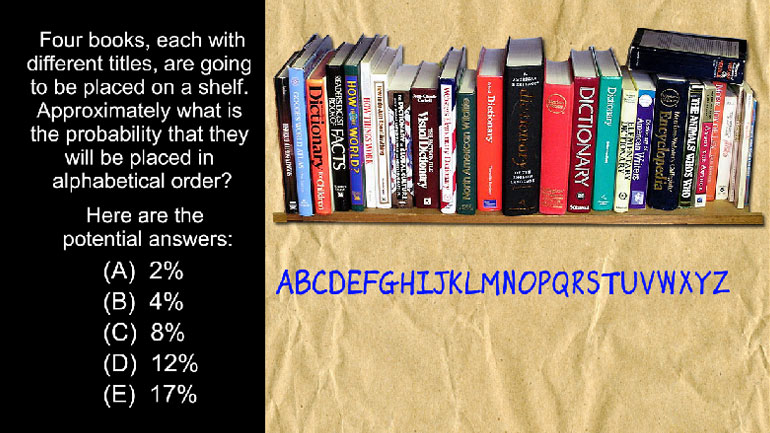


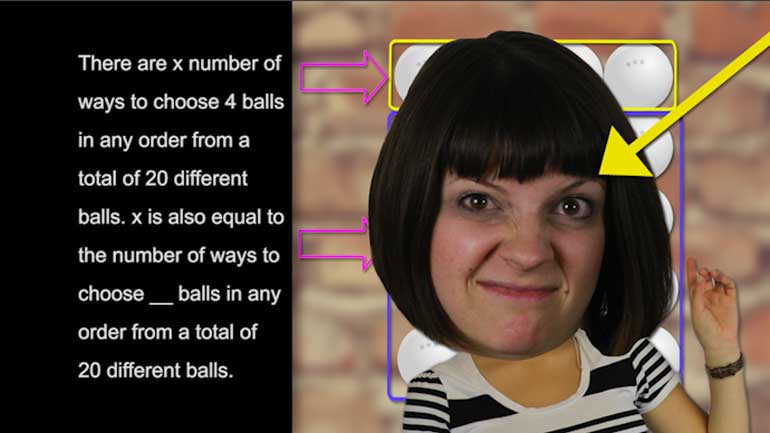


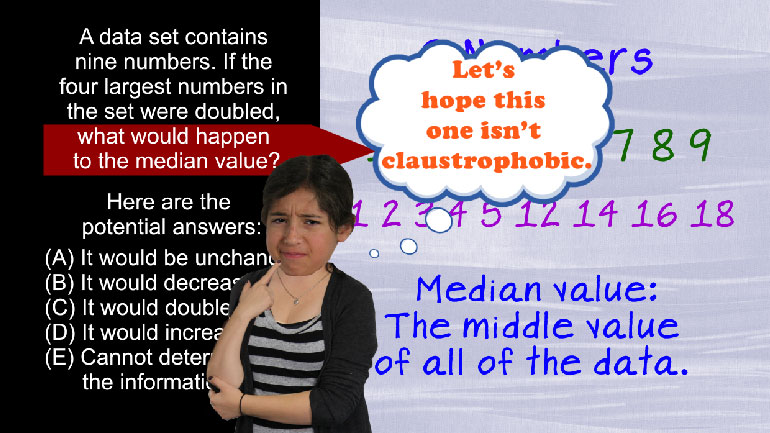
SAT Math: Statistics and Probability Drill 1, Problem 2. If the four largest numbers in the set were doubled, what would happen to the median...
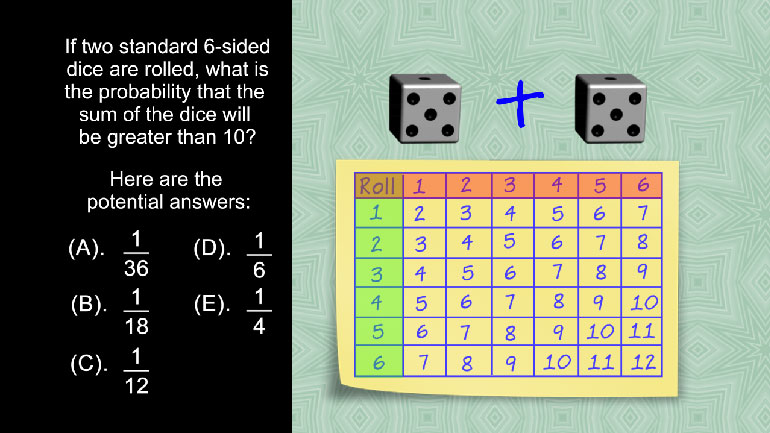
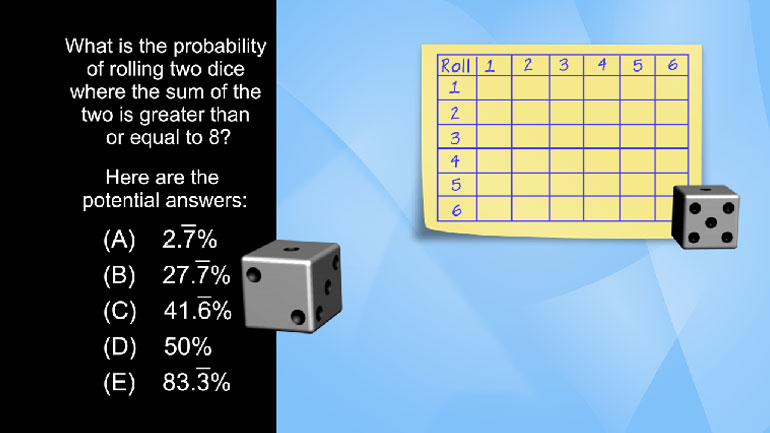
SAT Math 1.4 Statistics and Probability. If two standard 6-sided dice are rolled, what is the probability that the sum of the dice will be gre...

SAT Math 1.5 Statistics and Probability. If Silas draws one card, then places it in his pocket and draws another, what is the probability that...
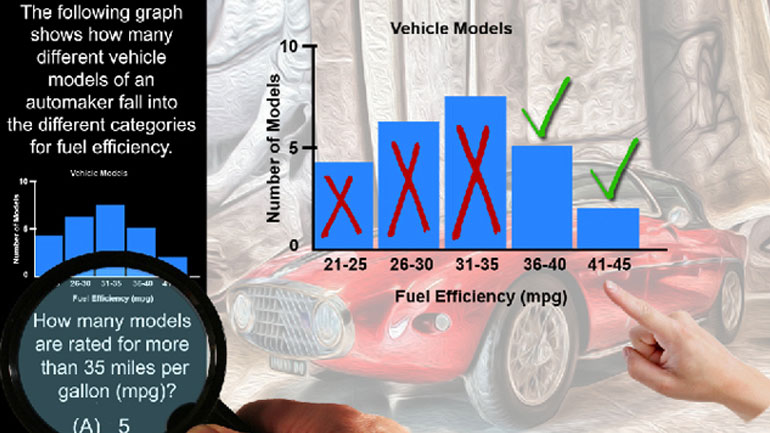
CAHSEE Math 4.1 Statistics, Data, and Probability II 226 Views
Share It!
Description:
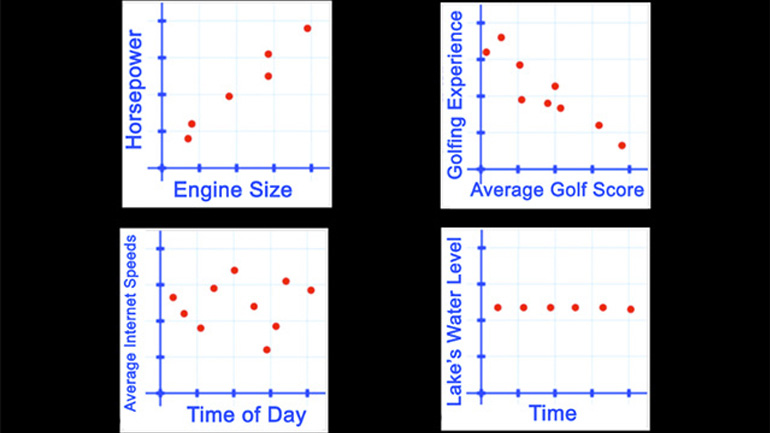
Statistics, Data, and Probability II Drill 4 Problem 1. Which of the following scatter plots represents a negative correlation between the data sets?
Transcript
- 00:03
Here's your shmoop du jour.
- 00:05
Which of the following scatter plots represent a negative correlation between the data sets?
- 00:12
And here are the potential answers...
- 00:17
Whoa. Negative corre-what?
- 00:20
Ok, five dollar word alert. A correlation occurs when something is similar to something else.
Full Transcript
- 00:26
Like… there’s a correlation between the TV viewing audience of Honey Boo Boo…
- 00:30
…and the number of antidepressants sold daily in the US.
- 00:35
So when a correlation is NEGATIVE it’s basically just saying that they’re NOT like each other.
- 00:40
In plot A, we can see that as engine size increases…
- 00:44
…horsepower also increases… so the two are POSITIVELY correlated with one another.
- 00:50
B is just the opposite… and THAT’s the one we’re looking for.
- 00:53
As golfing experience increases, golf scores go down.
- 00:59
So our answer is B.
- 01:01
As in, “Bogey.”
Related Videos

CAHSEE Math: Algebra and Functions Drill 5, Problem 3. Solve the equation.
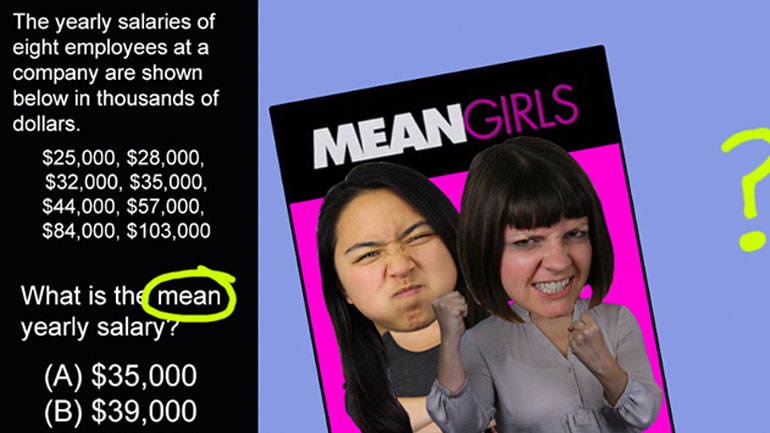
Statistics, Data, and Probability I: Drill Set 1, Problem 1. What is the mean yearly salary?

Statistics, Data, and Probability I: Drill Set 1, Problem 2. What is the median length of these writing utensils?
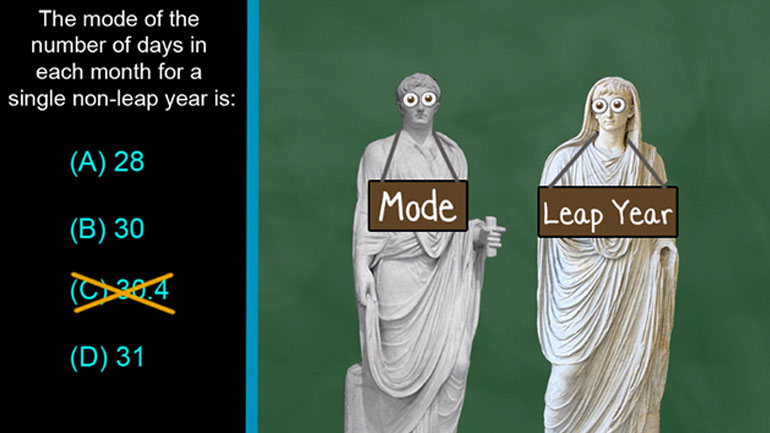
CAHSEE Math Statistics, Data, and Probability I: Drill Set 1, Problem 3. The mode of the number of days in each month for a single non-leap year is...
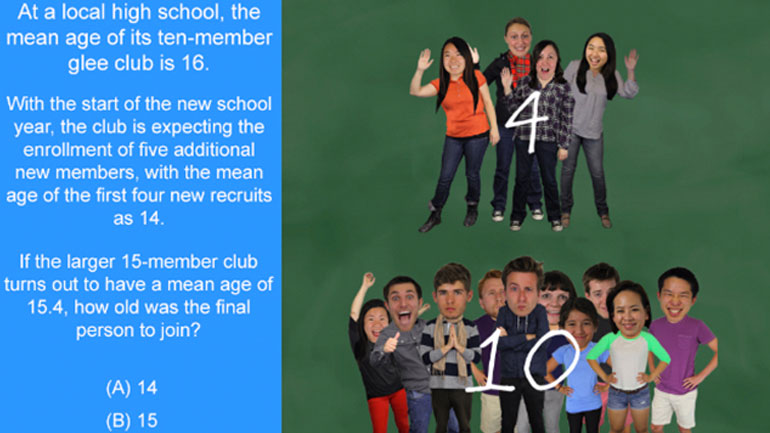
Statistics, Data, and Probability I: Drill Set 1, Problem 4. How old was the final person to join?