ShmoopTube
Where Monty Python meets your 10th grade teacher.
Search Thousands of Shmoop Videos
Summarize, represent, and interpret data on two variables Videos
Play All

CAHSEE Math 6.4 Statistics, Data, and Probability II
186 Views
Statistics, Data, and Probability II Drill 6 Problem 4. What conclusion can be drawn from the graph?

GED Math 2.2 Measurement
200 Views
GED Math: Measurement Drill 2, Problem 2. 55% of consumers preferred paper in the year...what?
CAHSEE Math 4.2 Statistics, Data, and Probability II
195 Views
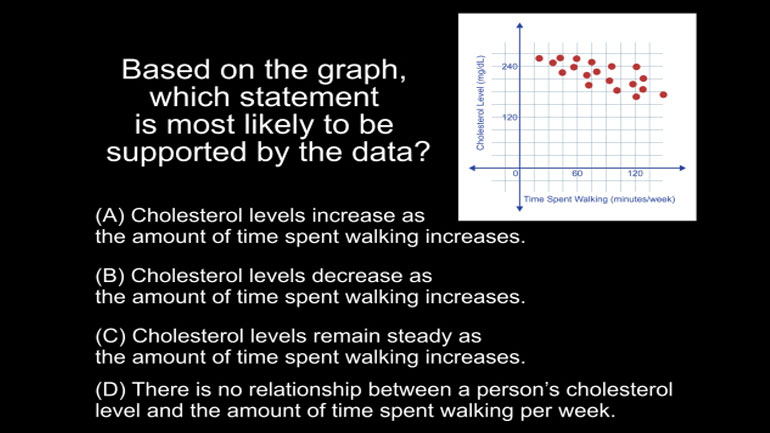
Statistics, Data, and Probability II Drill 4 Problem 2. Based on the graph, which statement is most likely to be supported by the data?