ShmoopTube
Where Monty Python meets your 10th grade teacher.
Search Thousands of Shmoop Videos
SAT Math: Transforming Functions on a Graph 1 Views
Share It!
Description:
Above is the graph of a function f(x). Which of the following graphs represent the function f(x + 2) – 1?
Transcript
- 00:00
Yeah Whoa Okay S a T math graph for Zala
- 00:05
shmoop Here we go Number one for you Above is
- 00:08
the graph of a function F of axe Which of
- 00:10
the following graphs represent the function F of X plus
- 00:15
two minus one We wish we could transform into a
Full Transcript
- 00:21
college student right now so that the days of the
- 00:23
would already be way behind us But unfortunately the only
- 00:26
transforming we're doing right now is with a function What
- 00:29
We don't need to know exactly what Ffx actually is
- 00:32
We just need to focus on the fact that the
- 00:34
new graph is F of X plus two minus one
- 00:37
u C f of X plus two tells us that
- 00:40
there's a shift of the graft to the left Two
- 00:43
units after the opposite of what the number's there While
- 00:47
the negative one moves the graph down by one unit
- 00:50
we gotta compensate by for one unit They're the only
- 00:53
graph that has a horizontal shift of Tuto left in
- 00:56
a vertical shift of one down his beat If function
- 00:59
transformations aren't easy for you to recall well no worries
- 01:03
Choose a point on the original graph and see what
- 01:05
the new function does to it Right So zero one
- 01:08
has both of our favorite Numbers So let's choose that
- 01:11
1 zero one is on the graph of F effect
- 01:13
So let's see what happens to this point After transforming
- 01:15
it by plugging zero into our new function it's f
- 01:18
of X plus two minus one there So we get
- 01:21
F zero plus two minus one which is F of
- 01:23
two minus one And this means that the point zero
- 01:26
on the X axis is now mapped Two F of
- 01:29
two months one on the Y axis Alright looking at
- 01:32
the original function right there f of two equals one
- 01:34
while half of two minus one equals one minus one
- 01:36
which is just zero beautiful Well zero now maps to
- 01:39
zero in our new function And B is the only
- 01:42
graph with a function that passes through the origin zero
- 01:45
zero So that's it be is it
Up Next
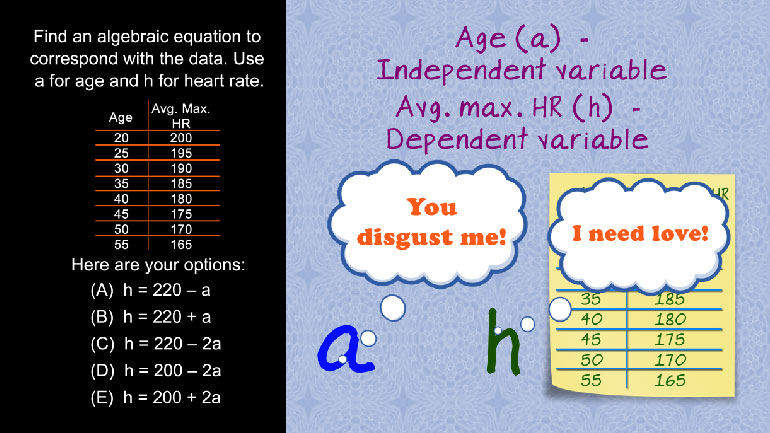
SAT Math 1.1 Algebra and Functions. Find an algebraic equation to correspond with the data.
Related Videos

SAT Math 1.1 Geometry and Measurement. What is the circumference of the circle?
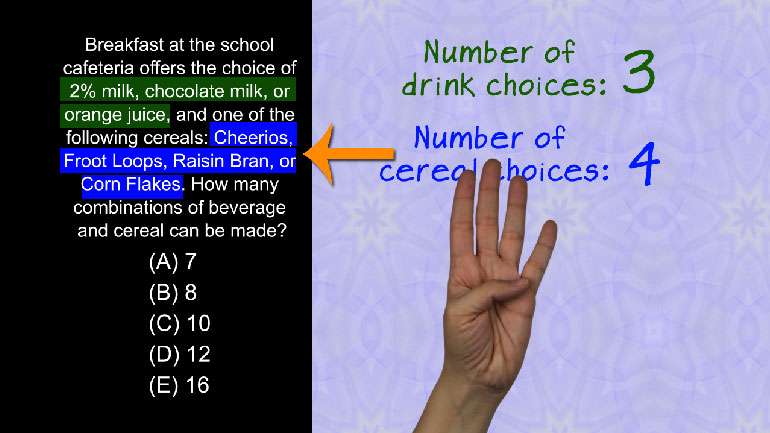
SAT Math 1.1 Numbers and Operations. How many combinations of beverage and cereal can be made?
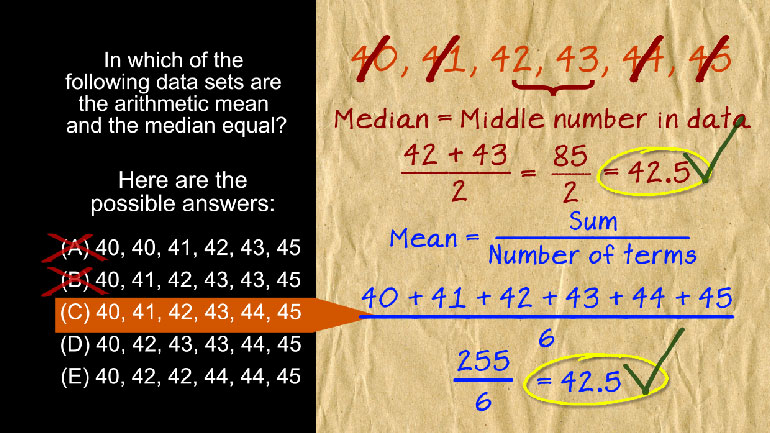
SAT Math 1.1 Statistics and Probability. In which of the following data sets are the arithmetic mean and the median equal?
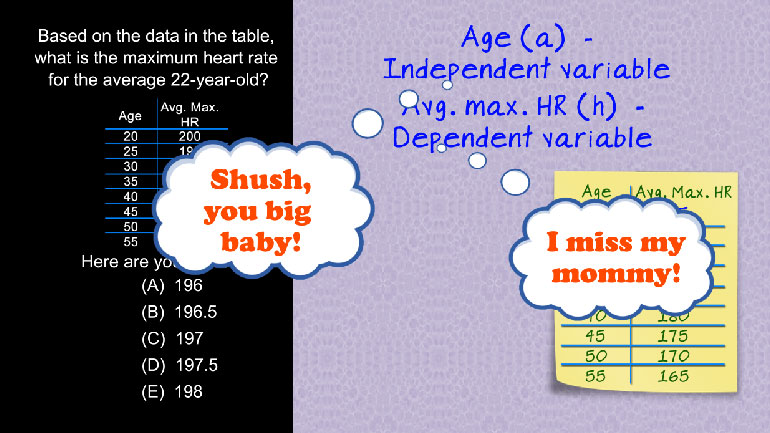
SAT Math: Algebra and Functions Drill 1, Problem 2. Based on the data in the table, what is the maximum heart rate for the average 22-year-old?