Graphs of trigonometric functions look a little crazy at first, especially if you're expecting to find more triangles. They aren't too bad, though, once we get the hang of them. Let's start by looking at a graph of a basic sine function, y = sin x:
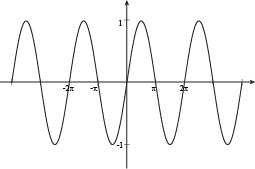
Up and down, up and down. We're starting to get a bit seasick looking at all these waves. If we look closely (urp), we can see that these waves are just the same thing repeated over and over and over and over and, well, you get the point.

The thing that's repeated is a cycle. They're easier to ride than a unicycle, and you don't have to wear a helmet while working with them. Functions that repeat themselves are called periodic functions. No, they aren't cyclic functions, those are something else.
Trig functions do have a period, though, and just not at the end of their sentences. The period is the horizontal length of one cycle, like from one peak to the next. For y = sin x, the cycle starting at x = 0 ends at x = 2π, so the period is 2π.
Trig functions also have a midline. It's a line that runs between the maximum and minimum y-values of the function; consider it the middle y-value. Think of the midline as a pair of comfortable pants that sit right on the function's waist. For y = sin x, the maximum value of y is 1, and the minimum is y = -1, so the midline is right in the middle at y = 0.
Once we know the midline, we can catch some the waves to find the amplitude, the height of the wave. Actually, it can be the distance between the midline and either the maximum or the minimum. Watch your step if you're going down. For y = sin x, this distance is 1.
Shimmy the Graph Around
Unfortunately, not all trigonometric functions are as simple as y = sin x. There are many changes that can be made to the formula that also cause changes in its graph. A fully dressed and accessorized sine function takes on the form:
y = Asin(Bx + C) + D
We have the constants A, B, C, and D here to complicate things. Jerks. Let's talk about them one by one.
Sample Problem
Graph y = 3sin x.
Now we have a function with A = 3. We know the look of the basic y = sin x. All we need to know is how y = 3sin x is different. It will be 3 times bigger; when sin x = 1, 3sin x will be 3. y = 3sin x will follow the same general shape as y = sin x, but the maximum will go all the way up to y = 3 and the minimum go all the way down to y = -3. In our graph, y = sinx is blue, while y = 3 sin x is red.
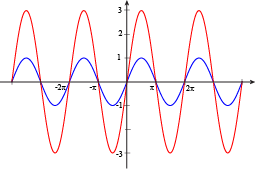
So, A tells us the amplitude of the function. It's as simple as that. If A is 1, our amplitude is 1; if it is 3, our amplitude is 3. It stretches the graph up and down, or smooshes it flat if A < 1.
Sample Problem
Graph y = sin x and y = sin(2x) on the same plot.
Let's put on our thinking caps here. If x =  , then we'll have y = sin (π). When x = π, then y = sin (2π). Hey, that's one cycle of sin x done, but in half the time. And x = 2π gives y = sin (4π), so that's a second cycle done already.

B affects the period, but isn't the period. The period is actually  . As the value of B increases, the period decreases, so we can fit a complete cycle in a smaller space. On the graph, we will see it as the wave getting more scrunched up.
Sample Problem
Graph y = sin(x + ).
Do you C what we C? We see a C of  , and it is what moves the graph left and right. It's a little tricky, though, because we move in the opposite direction for the sign of C, so by -C. We'll be shifting sin x to the left by . If we had x – , then we would move to the right.

The actual amount of shifting is , so if B is anything other than 1, we need to take care of that too. Don't let B ruin your graph. If we remember how much to shift using this formula, it takes the direction into account for us. That's handy, dandy, and we don't remember the third part.
Take another look at that graph of y = sin (x +  ). We happen to know this function by another name: y = cos x. Yep, sine and cosine are practically twins. That does explain why people sometimes mix the two up. It's really not that hard; cosine is shifted to the left of sine by . Also, at x = 0, sin x = 0 while cos x = 1. We can tell those twins apart at a glance.
Sample Problem
Graph y = sin x + 2.
D grabs the function's pants, shifting the midline up or down. When D is 2, the midline goes up by two. Here, positive actually means what it usually does (up), so that's nice.

The midline of y = sin x is at y = 0, while the midline of y = sin x + 2 is at y = 2. The value of D moves the graph up and down.
Summary
Need help remembering you’re ABCD's for when you have to deal with y = Asin (Bx + C) + D (and cosine too)?
- The amplitude marks the highest-highs and lowest-lows of a trig function, and it equals A.
- The period tells us how quickly we cycle through the function's iPod playlist. It equals
 .
. - Take the original function, then shift left and right by.
- Move the midline up and down, from y = 0, by D.
Oh, By the Way…
For a quick tangent, let's discuss tangents. Here is a graph of y = tan x for your viewing pleasure:
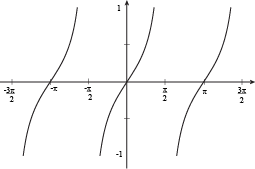
There is no amplitude to measure here, because the graph extends forever up and down. The graph has vertical asymptotes at every (n + 0.5)π units. The tangent graph can be changed much like sine and cosine can, but we'll give you a break and stick with sine and cosine.