To understand when the midpoint rule gives an underestimate and when it gives an overestimate, we need to draw some pictures.
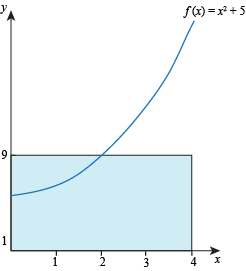
Let R be the region between the function f(x) = x2 + 5 on the interval [0, 4]. Take a midpoint sum using only one sub-interval, so we only get one rectangle:
The midpoint of our one sub-interval [0, 4] is 2. Draw the tangent line to the function f at x = 2. This tangent line "cuts off" a triangle from the rectangle. Now we have a new shape with the same area as the original rectangle.
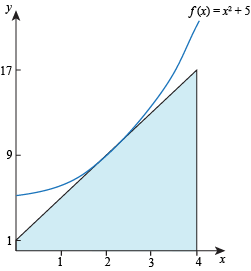
The new shape doesn't cover all of R. This means the area of the new shape is an underestimate for the area of R. Since the new shape and the original midpoint sum rectangle have the same area, the midpoint sum is also an underestimate for the area of R.
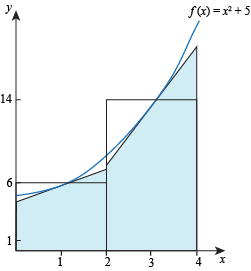
If we use more sub-intervals, the punchline is the same. The midpoint sum gives us one rectangle per sub-interval. We can replace each rectangle with a shape that has the same area and doesn't cover the entire area between the function and the x-axis on its sub-interval. For example, here are the original rectangles and new shapes if we use 2 sub-intervals:
Now let S be the region between the function
f(x) = 17 – x2 and the x-axis on the interval [0, 4].
Take a midpoint sum using only one sub-interval. The midpoint of our one sub-interval [0, 4] is 2. Draw the tangent line to the function f at x = 2. Again, the tangent line cuts off part of the rectangle. We have a new shape with the same area as the original rectangle.
However, this time the new shape covers more area than it needs to. The area of the new shape is an overestimate for the area of S. Since the original rectangle has the same area as the new shape, the original midpoint sum was also an overestimate for the area of S.
To summarize: whether the midpoint sum provides an over- or -under- estimate depends on concavity. If the function is concave up, the tangent line lies under the graph so a midpoint sum produces an under-estimate. If the function is concave down, the tangent line lies over the graph so a midpoint sum produces an over-estimate. If the function has no concavity (is a straight line), a midpoint sum produces the exact area between the function and the x-axis on the specified interval. Whether the function is increasing or decreasing has no effect on whether a midpoint sum produces an underestimate or overestimate.