Would you rather go on a ski slope or a water slide? Whichever you choose, that's the shape of an exponential function. We're going to show you their graphing behavior and effects of parameters in the equations. We're going to use vocabulary like growth and decay. Go grab your swimming suit or ski gear and let's jump on this slope, maybe we'll catch a little air.
Exponential functions are always curved and continuous, and they sort of look like "half of a parabola." You will notice that all exponential functions rise on the left or the right, and on the opposite side they look like they are converging to one y value. This y value is called a horizontal asymptote.
The Big Bad Horizontal Asymptote: there is an imaginary line in each exponential function that the curve will keep trying to touch but will never quite get there. This is one of those very tough concepts for the human mind to grasp. Picture yourself facing a wall and moving towards it. Every step you take is a little bit smaller. If you decrease your step by half each time, you will never actually make it to the wall. You can keep walking forward forever, but you will never get there. Ever.

Sample Problem
Look at the graph of this function:
f(x) = 1.3x

Notice the graph above is increasing "without bound" from left to right. In precalculus terms, that means that as x approaches infinity, the value of y increases exponentially towards infinity. This graph is an exponential growth function. You might be confused whether 1.3 is a or b. Since the base is 1.3 and there is no number in front, a = 1 and b = 1.3. Notice the function has a b value that is greater than 1.
Here are some facts about the figure above:
- Exponential growth
- Domain: All real numbers
- Range: (0,∞)
- Continuous? Yes
- Is the function increasing or decreasing? Increasing
- Horizontal asymptote: y = 0
- Concave up
- Likes long walks on the beach and Nora Roberts novels
Sample Problem
Graph and describe:
f(x) = -2(3.9)x
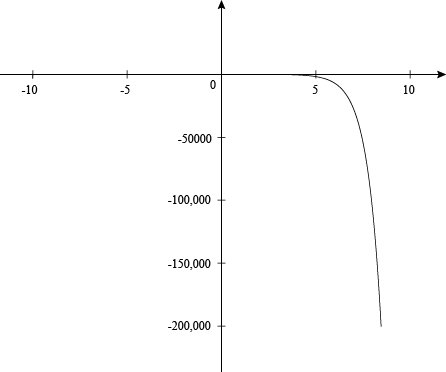
The graph above is decreasing from left to right and the y values are going deeply negative as x increases. Notice how the y value on the graph is at around -200000 at x = 10. This also means that it is an exponential growth function. What? Exponential growth that is negative? Notice the equation has a b value that is greater than 1, but the a value is negative. The a value is causing the right end behavior of the function to fall.
Here are some facts about the graph above:
- Exponential growth (negative growth)
- Domain: All real numbers
- Range: (0, -∞)
- Continuous? Yes
- Is the function increasing or decreasing? Decreasing
- Horizontal asymptote: y = 0
- Concave down
- Was recently a contestant on Wipeout
Sample Problem
Graph and describe:
f(x) = 2(0.6)x + 50

The lovely graph above is decreasing from left to right but notice the y values are getting closer and closer to 50 as the x values increase. Also notice that the b value is 0.6. If the value of b is between 0 and 1, this tells us it is an exponential decay. Yum, zombie decay. Just kidding. This type of decay just means the y values are getting slightly less for each x value.
If you glance back at the original problem, you can see there is a +50 on the end of the function, and that shows the horizontal asymptote is at y = 50.
Here are some facts about the graph:
- Exponential decay
- Domain: All real numbers
- Range: (50, ∞)
- Continuous? Yes
- Is the function increasing or decreasing? Decreasing
- Horizontal asymptote: y = 50
- Concave up
- Enjoys bird watching conventions and hot air balloon festivals
Sample Problem
Graph and describe:


This graph is increasing from left to right and as you can see, the horizontal asymptote is at y = -10. Although the exponential curve is under the x-axis and has all negative y-values, it is trending towards one y-value of -10 which means it is another exponential decay function.
Here are some facts about this graph:
- Exponential decay
- Domain: All real numbers
- Range: (∞,-10)
- Continuous? Yes
- Is the function increasing or decreasing? Increasing
- Horizontal asymptote: y = -10
- Concave down
- Likes kickboxing and collects Spencerian script fountain pens
Sample Problem
Graph this exponential function:

When graphing functions of any type, it's best to start out with an  table. Choose different values of x and find the values of y, which is f(x). The table below shows how to calculate the y values for various x values we chose.

Now, we can simply graph the coordinates on a grid and we should get something that looks like this:

This is a classic exponential decay graph. More like the decay in our refrigerator. Decay that cannot and must not be stopped, as it may contain the antidote to the zombie virus.