We now have enough tools to draw some complicated functions from scratch. Now we know how graphing calculators do it, and why they require the energy of four triple-A's.
When drawing a rational function f(x) from scratch, we need to know a lot of information, which can be nicely grouped into three big chunks.
- We need to know where f has vertical asymptotes and/or holes.
- We need to know the horizontal/slant/curvilinear asymptotes of f, if any.
- We need to know about values of f. We found where f is undefined when we found the vertical asymptotes and holes; now we need to know where f(x) is 0, positive, and negative. We also want to know f(0), also called the y-intercept.
Example 1
Graph the function |

 .
.
Example 2
Graph the function |
 .
.

 .
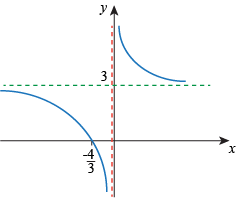
. the numerator and denominator are both negative, therefore f is positive. When
  , the numerator is positive and the denominator is negative, so f is negative.
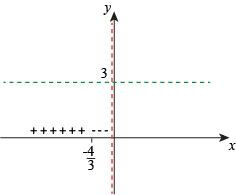

Example 3
Graph the function |


 :
:

 :
:


Example 4
Graph the function
Label all asymptotes, intercepts, and holes. |
 .
.


Exercise 1
Graph the function. Label all asymptotes, intercepts, and holes.


Exercise 2
Graph the function. Label all asymptotes, intercepts, and holes.


 , and f(4) = 0.
Exercise 3
Graph the function. Label all asymptotes, intercepts, and holes.


 and f is 0 when x = -2.
Exercise 4
Graph the function. Label all asymptotes, intercepts, and holes.


Exercise 5
Graph the function. Label all asymptotes, intercepts, and holes.

