Functions and Their Graphs
Function, function, what's your function? Are you a personal trainer, a famous spy, a doorstop, or something else entirely? We think it's the last one.

A function takes some input, usually called x, into an equation, f(x). Then x winds its way through the equation, and at the end we get some output, usually known as y. Notice that y and f(x) are actually the same thing. Maybe y is the famous spy?
We call x the independent variable, and y the dependent variable. So x has a nice job, while y still lives at home. All the possible x-values are the domain, and all the possible y-values are the range.
Sample Problem
Find the domain and range of y = 3x – 4, where 0 ≤ x < 4.
If we were just given the equation, y = 3x – 4, without saying anything else, we would say that the domain is all the real numbers. That leaves out the imaginary, fake, delusional, and poseur numbers.
In this case, though, we can't pick any x we like under the sun. The problem says that 0 ≤ x < 4. This means that our domain is limited to all the real numbers between 0 and 4, including 0 but not 4 (because of the line underneath the hungry Pac-man mouth).
Now, the range. A range is all possible y-values. In our equation, y = 3x – 4, the y-values are what we get when we plug in the x-values that we know. Let’s make a table to pin down the range.

The range of this function is -4 ≤ y < 8. Notice that y is less than 8, because x cannot equal 4, so y can never exactly equal 8 either.
In this case, the range is easy; we could look at the smallest and largest values of x, and those give us the smallest and largest values of y. What if we had something like y = -x2, with -2 < x < 2?
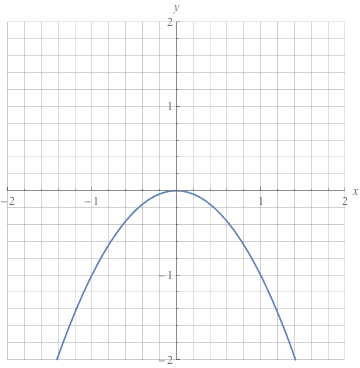
Here, if we just plug in x = -2 and 2, we get y = -4 for them both. We know that y doesn't just sit at -4 the whole time, though. We have to check x = 0 to find that y = 0 there, giving us a range of -4 < y < 0. Any time that the graph might swoop or dip, check a variety of numbers to find the correct range.
Now let's talk about graphing functions for a second. Actually, let's talk and graph at the same time. Just don't ask us to chew gum, too.
Sample Problem
Graph y = 3x – 4, where 0 ≤ x < 4.
Oh, it's you again. You're going to be recurring thing, aren't you?
That's okay, because it means we've done a lot of the work already. We know the domain and range, and we've plugged in several points.
Start by drawing a coordinate plane. The x-axis is chilling on its back, lying down, while the y-axis is standing at attention. They meet up in the middle at the origin. Don't try too hard to visualize that; it actually isn't as painful as it seems. We hope.
We use the numbers on the axes to plot our points and make our line. We make ordered pairs that look like this: (x, y). And x always calls shotgun, so y never gets to go first.
Starting at the origin, (0, 0), positive values of x move to the right and positive values of y move up. Move both numbers together to plot each point from our table.
See how nicely they line up? Why couldn't they look this nice for their school pictures? Well, let's draw a line through them while they're sitting still.
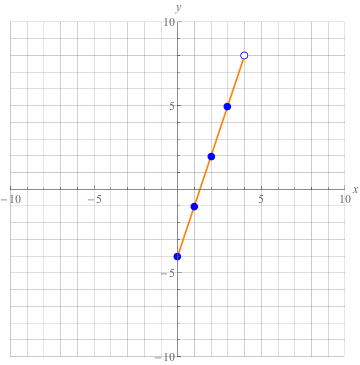
We have a limited domain here, so we only draw the line where the function actually exists. Non-existent lines are surprisingly easy to draw, so be on the lookout for them.
Verticality
There's something very important about functions. In fact, it's so important that we're going to put it on its own line:
For every x, there is only one y. To put it another way, every input has only one output. One x enters, one y leaves.
If an equation violates this principle, it's not a function. Luckily, we don't have to plug in and check every x-value to see if any of them share a y-value. That would be tedious and awful. Instead, we can use the vertical line test. What a name, eh?
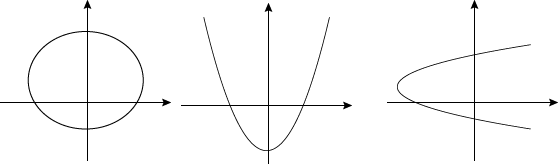
Take these graphs, for instance. The test is exactly what it sounds like: drawing vertical lines on top of the graph. If any vertical line can pass through the graph more than once, then the equation is not a function.
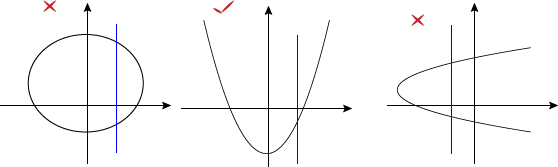
See? We can tell at a glance what is a function and what isn't. And notice how the second graph in the middle has the same y-value for two different x-values (like at y = 0, for instance). That's totally allowed. We just can't have the same x-value for more than one y-value, like in the first and third graphs.
From here on, we'll be dealing with linear equations, which are easy to classify as linear functions (ooh, title drop). Is it a vertical line? If not, then yes Virginia, it's a function.