Math teachers and professors across the globe try to make limits into this big, huge deal. We're here to set the record straight. In fact, that's our mission: to prove that limits are one of the most straightforward mathematical ideas around.
Imagine it is the middle of the night and we've been up for hours studying for our precalculus final. We need a snack, pronto. So we head to the kitchen and see a giant chocolate cake sitting right in the middle of the table. The cake looks perfect so we start to move toward it.

As we approach the cake, the distance between us and the cake is cut in half, say from 10 feet to 5 feet. It's a long kitchen, okay. As we continue, the distance is cut in half again to 2.5 feet, to 1.25 feet, to 0.625 feet, and so on. As we go on, the distance between us and that cake continues to be cut in half.
This presents a huge problem because, by this logic, we will never actually reach the cake. #midnightsnackprobs
While we all know that eventually we will be able to break through and take a huge bite of delicious cake, this idea of approaching something without actually ever reallllllly getting there is exactly the way to describe a limit.
Sample Problem
Evaluate the limit of f(x) = x + 3 as x approaches 1. In other words evaluate:

Before we get to work, let's make sure we grok the notation used. The "lim" says that we are looking at the limit of the function to the right. Underneath the "lim" we have x –> 1. This means that we are looking at the given function as x approaches 1.
In words, we read this as "the limit of x + 3 as x approaches 1."
This notation is asking us what happens to the function as the x values get close to, but not quite touch, 1. What does the y value look like as x gets closer and closer to 1? Let's look at the function's graph.
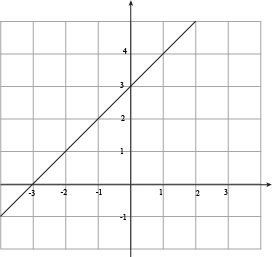
It isn't too tough to see that the y values mosey up to y = 4 as x gets closer to 1. So we would say "the limit approaches 4 as x approaches 1." That's a lot of words for a math answer, so we can instead write:

It is devastatingly important to know that this is the limit only because the graph is approaching 4 on both sides of 1. Yes, the number 1 has two sides. One has a positive side and a negative side—we can approach it from the left or the right. Check out the next problem-o.
Sample Problem
Evaluate the limit of this function as x approaches 0.

This is our second limit, and we already have weird, broken-looking graphs. No worries. Like we said before, zero has a negative (or left) side as well as a positive (or right) side. In order for us to say that a limit exists, the limit from the left and right have to be the same.
We see a problem here, then. The left hand disagrees with the right hand. "It's going towards 4." "Are you blind, it's going to 0." When we have such differences of opinion, we say that "the limit Does Not Exist." Yes, it's capitalized like that, because we really mean it.
If you want to look big time, abbreviate Does Not Exist as DNE. Anyone who's anyone will know what you're talking about. #mathswag
Sample Problem
Use the graph of the function f(x) to evaluate the given limits.

a) 
Because the values of y are the same from both the left and the right, we can say that  .
.
Wait, what? But the function is undefined at x = a; at least, that is what our pre-precalculus teacher told us open circles mean. So shouldn't the limit be undefined here, or nonexistent, or something like that?
Nope. The open circle does mean the function is undefined at that particular x-value. However, limits do not care what is actually going on at the value. Limits only care about what happens as we approach it. That. Is. All.
b) 
The function is approaching y = 1 from the left. The function is also approaching y = 1 from the right. As a result,  .
.
(c) 
This is where things fall apart. The function is approaching y = 3 from the left, but it approaches y = 1 from the right. As a result, = Does Not Exist.
Always take the time to check both sides of a limit. And always take it to the limit.