Don't worry if the last time you graphed something was when you were tracking the life and hard times of your ever-shrinking bank account. Graphing rational functions is not rocket science, and it won't break the bank (unlike that last purchase—a sweet ukulele).

When we evaluate a function for specific values, we're finding an ordered pair (think Tweedle Dee and Tweedle Dum, Mary Kate and Ashley, peanut butter and jelly). If we find that f(0) = 2, for example, that means the point (0, 2) is on our graph.
If we get a big, fat "undefined" for a specific value of x, that shows us where the graph's asymptotes are. Asym—what?
To translate from math-speak, an asymptote is an imaginary line that a graph approaches but never touches. The graph will just get closer and closer to the asymptote. Close, but no banana.
Vertical asymptotes happen wherever the denominator is zero, which makes the fraction undefined. (Remember that no-no?) We draw vertical asymptotes as dotted vertical lines, and our curve shouldn't ever quite hit those dotted lines.
Intercepts also help us in our graphing endeavors. We find the y-intercept of the function by solving for f(0), which tells us where the curve hits the y-axis. We find the x-intercept of the function by setting the numerator equal to zero. That tells us where our function hits the x-axis. Once we have our asymptotes and intercepts, we dig up other points we'll need to draw the rest of the graph.
Fair warning: these guys are gonna have some pretty weird shapes when we graph them.
Sample Problem
Graph  .
.
Find any asymptotes by checking for which values make the denominator equal to zero.
In this case, f(x) is undefined for x = 0. This means that the line x = 0 (a.k.a. the y-axis) is a vertical asymptote.
Now for the intercepts:
We find the y-intercept by evaluating f(0). But for this case, f(0) is undefined. So there is no y-intercept.
We find the x-intercept by setting the numerator equal to zero. In this case, the numerator is simply 1. There is also no x-intercept.
However, the x-axis does act as a horizontal asymptote. The graph approaches the x-axis but will never touch it. Same goes for the y-axis.
Let's make a table to get a few more points.

Now, plot our points.
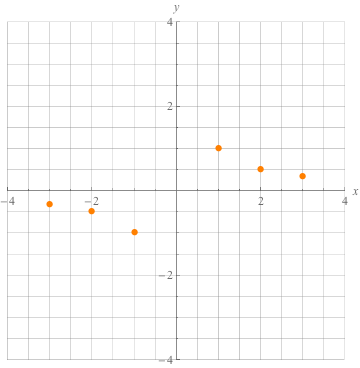
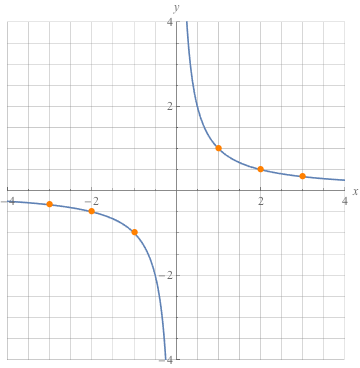
Hmmmm, something tells us that we don't have enough information to finish the graph. Let's add a few more points to our table.

Add those points and see what we get.
Sample Problem
Graph  .
.
Find any asymptotes by checking for x-values that turn the denominator into zero.
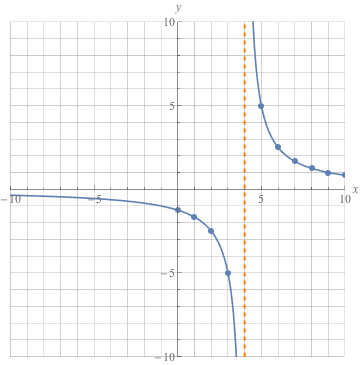
In this case, f(x) is undefined for x = 4. That tells us x = 4 is an asymptote. Let's sketch a dotted vertical line right there.
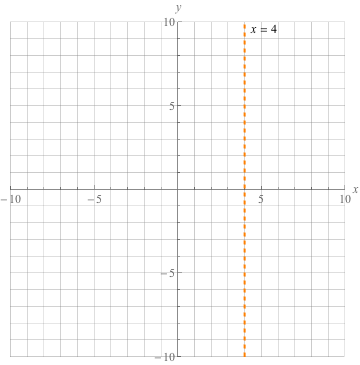
Now for the intercepts. We find the y-intercept by evaluating f(0).

So the y-intercept is  .
.
We find the x-intercept by setting the numerator equal to zero. But in this case, the numerator is simply 5. So there is no x-intercept.
But once again, the x-axis acts as a horizontal asymptote. The graph will approach it but never cross it.
Let's make a table to get a few more points.

Now we can plot the points from the table, with the asymptote at the undefined spot.
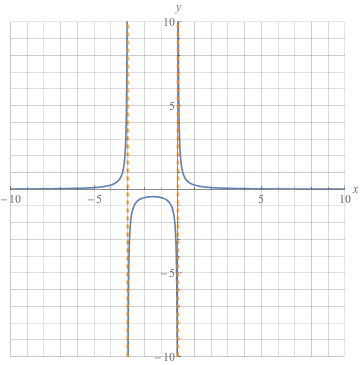
Sample Problem
Graph  .
.
Asymptote time. In this case, f(x) is undefined when the denominator is zero, which means:
x2 + 3x = 0
Factor and solve to find the zeros.
x(x + 3) = 0
So x = 0 and x + 3 = 0, giving us zeros of x = 0 and x = -3. Whoa, that means we have two vertical asymptotes at x = 0 and x = -3.
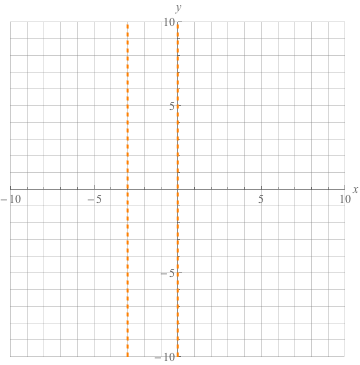
Sketch the axes, and draw in a dotted vertical line at x = -3. Don't forget, we've also got a vertical asymptote at x = 0, so imagine a dotted line over the y-axis too.
Since x = 0 is an asymptote, we have no y-intercept.
And once again, we can't set the numerator equal to zero, so there's no x-intercept; however, the x-axis does act as a horizontal asymptote.
We need a table to get a few points.

Plot the points from the table. And sketch in a graph using the x-axis, x = 0, and x = -3 as asymptotes.