We have all had sliced bread. It's been around since 1928. Two-dimensional graphs have been around for a while, too. While number lines are nice, we can't tell which dots go with which terms. Since we know as much about 2-D graphs as we do sliced bread, we may as well use them and see what happens.
To graph a sequence on a 2-D graph, we put n on the horizontal axis and an on the vertical axis.
For each term an of the sequence we graph the point (n, an).
Sample Problem
Plot the first five terms of the sequence  , starting at n = 1, on a graph.
Answer.
We plot the points

to get this graph:
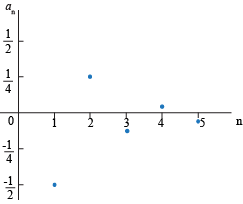
Even though the terms flip back and forth like a floundering fish, we can see that the values an get closer to 0 as n gets larger.
After going through this example, you don't need your fortune-telling turban or crystal ball to see we're heading for limits of sequences. Back the bus up for a second. First, we should go through a couple exercises to see a few more sequences plotted in two dimensions.


