ShmoopTube
Where Monty Python meets your 10th grade teacher.
Search Thousands of Shmoop Videos
SAT Math: Comparing Slopes Between Different Points on a Line 11 Views
Share It!
Description:
The graph above shows approximate populations of England at different dates during the Industrial Revolution. According to the graph, what is the difference between the population growth between 1821 and 1831 and the population growth between 1811 and 1821?
Transcript
- 00:00
Yeah Whoa Okay Math shmoop er's last in this Siri's
- 00:06
here and we're graphing the population growth of England here's
- 00:10
population and yeah Amazing what washing your hands will dio
- 00:14
to increase the population Yeah well graph above shows approximate
- 00:17
populations of England at different dates during the Industrial Revolution
Full Transcript
- 00:21
According to the graph what is the difference between the
- 00:23
population growth between eighteen twenty one in eighteen thirty one
- 00:27
and the population growth between eighteen eleven eighteen twenty one
- 00:33
So they're talking about the rate of growth different So
- 00:35
ding ding ding We're talking slope here between this section
- 00:39
and this section and you can tell this one has
- 00:41
a higher slope just visually looking at it than this
- 00:44
one does but didn't give us numbers So let's just
- 00:47
actually think through a problem Here are the good old
- 00:49
days of textile steam engines ripped arms out of their
- 00:52
sockets railways and oh so many people as part of
- 00:55
the Industrial Revolution About one hundred thousand people each year
- 00:58
in fact kind of part of it growing In part
- 01:01
of it we found this answer by starting with slopes
- 01:04
So we got two slopes here twelve minus ten million
- 01:09
people over this ten year period Right And then we're
- 01:12
going to subtract the ten minus nine million people in
- 01:16
this section here That's eighteen twenty one among is eighteen
- 01:19
Elevens We got a ten year period there was that
- 01:21
equal That's two million people over ten years minus one
- 01:25
million people over ten years And that gets us a
- 01:27
million people over ten years or one hundred thousand people
- 01:30
a year Holy Manchester Where's our boy Tommy Malthus When
- 01:34
we need him member population And that's who Malthus is
- 01:37
So the answer is B The difference in population growth
- 01:40
is determined by that slope difference or a hundred thousand 00:01:43.83 --> [endTime] people a year
Up Next
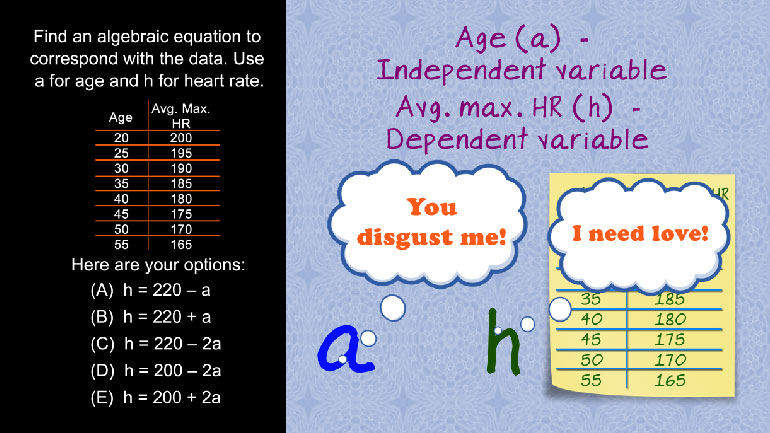
SAT Math 1.1 Algebra and Functions. Find an algebraic equation to correspond with the data.
Related Videos

SAT Math 1.1 Geometry and Measurement. What is the circumference of the circle?

SAT Math 1.1 Numbers and Operations. How many combinations of beverage and cereal can be made?
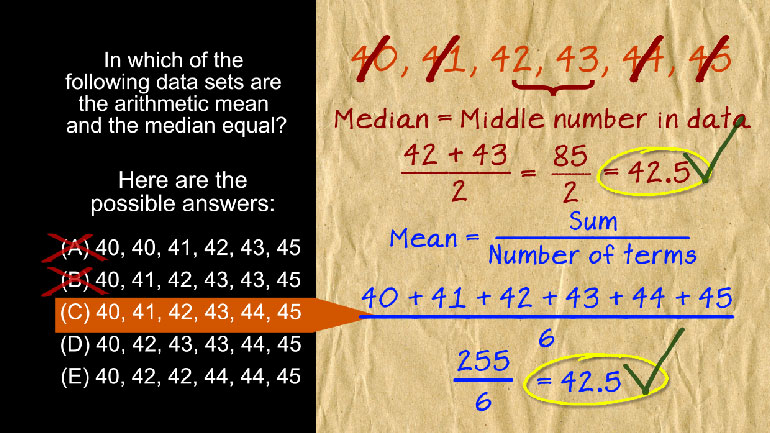
SAT Math 1.1 Statistics and Probability. In which of the following data sets are the arithmetic mean and the median equal?
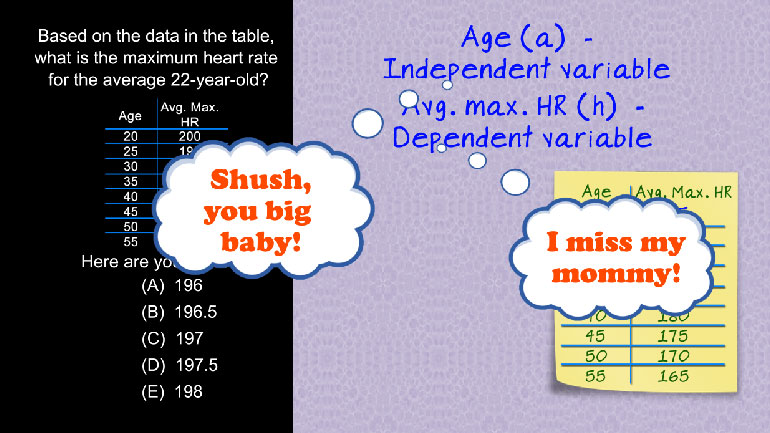
SAT Math: Algebra and Functions Drill 1, Problem 2. Based on the data in the table, what is the maximum heart rate for the average 22-year-old?