ShmoopTube
Where Monty Python meets your 10th grade teacher.
Search Thousands of Shmoop Videos
SAT Math: Making Predictions Using the Slope of a "Best Fit" Line 27 Views
Share It!
Description:
The scatterplot above shows data indicating the annual profit from computer sales by a technology company in a given year. Researchers use a line of best fit to estimate the annual profit for years not shown in the graph above. Which of the following would these researchers estimate was the annual profit from computer sales for the year 2011?
Up Next
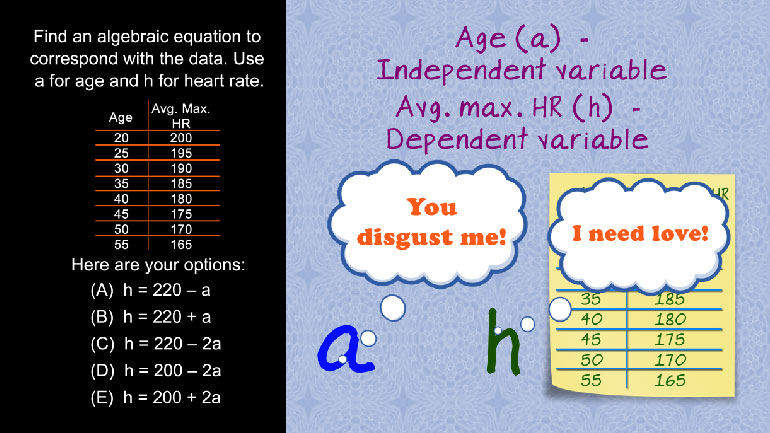
SAT Math 1.1 Algebra and Functions. Find an algebraic equation to correspond with the data.
Related Videos

SAT Math 1.1 Geometry and Measurement. What is the circumference of the circle?

SAT Math 1.1 Numbers and Operations. How many combinations of beverage and cereal can be made?
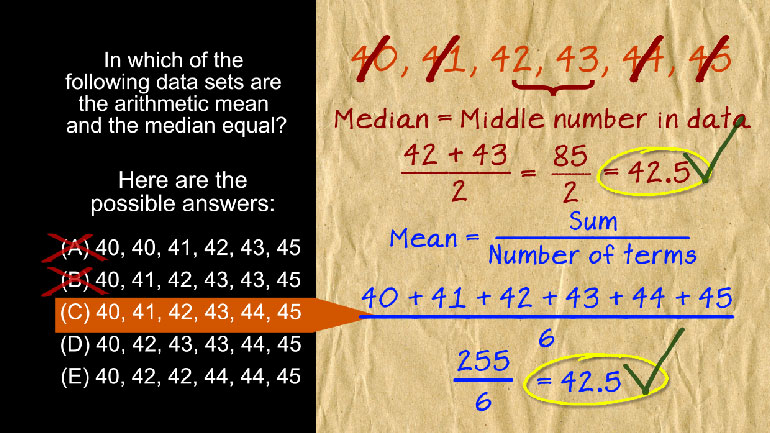
SAT Math 1.1 Statistics and Probability. In which of the following data sets are the arithmetic mean and the median equal?
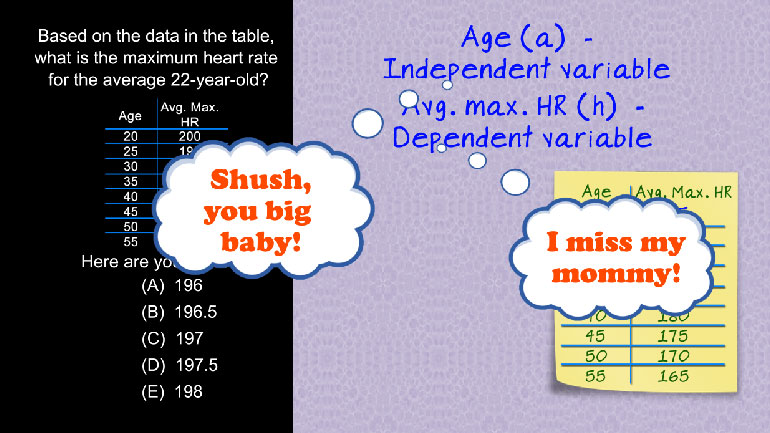
SAT Math: Algebra and Functions Drill 1, Problem 2. Based on the data in the table, what is the maximum heart rate for the average 22-year-old?