ShmoopTube
Where Monty Python meets your 10th grade teacher.
Search Thousands of Shmoop Videos
Charts, Graphs, and Tables Videos
Play All
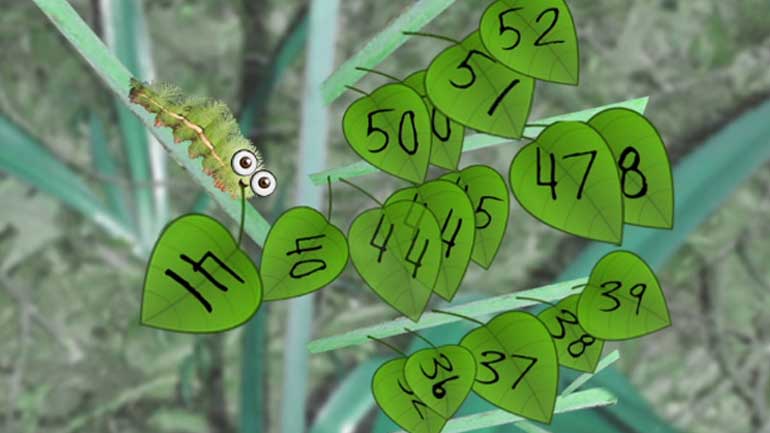
This video covers how to set up a stem and leaf plot and use it to find the mean and median of a set of numbers.

Knock-Knock. ¡Histograma cantante! Aquí para cantarte a tí acerca de toda la alegría y maravillas de lo que hacemos. ¿Te interesaría adquirir...

Estos no son tan lindos como suenan. Tu no quisieras encontrar un ejercicio práctico tal como "yo puedo tener una hamburguesa de queso". Pero como...

Lo mejor para realizar los conjuntos es que los tienes para usar los diagramas de Venn. Y si hay algo en esta palabra más divertida que el diagram...
This video shows all the steps to creating a Box and Whisker Plot: finding the median of a list of numbers, calculating the values for Quartiles I,...
Tu podrías haber crecido realmente unido a tu mascota daffodil, pero no—este no es el lugar donde las plantas son enterradas cuando mueren. De h...
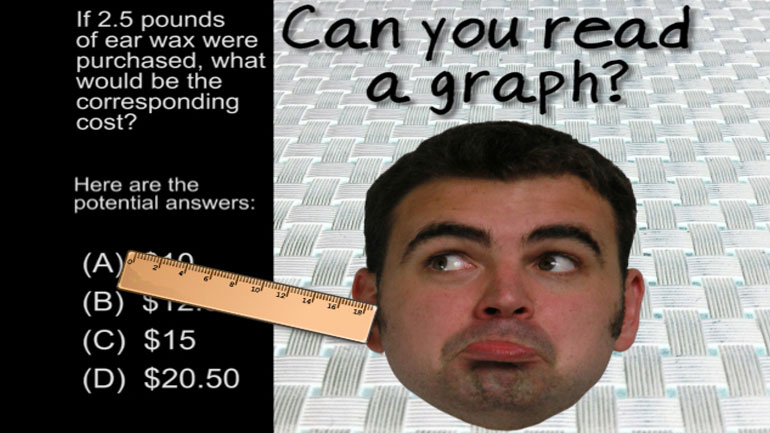
Algebra and Functions: Drill 2, Problem 2. If 2.5 pounds of ear wax were purchased, what would be the corresponding cost?
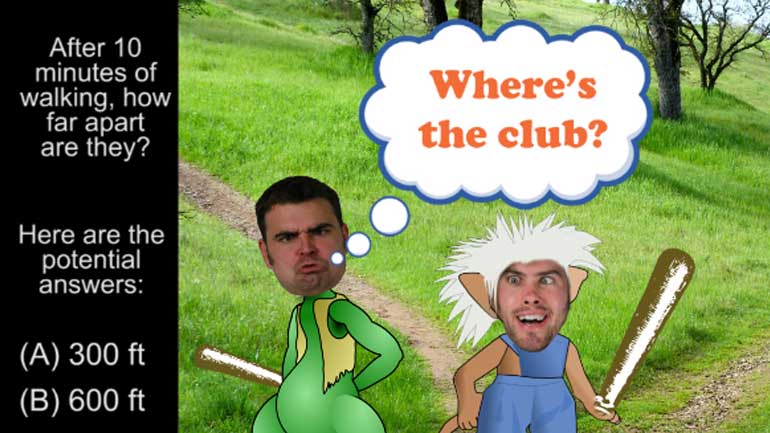
Algebra and Functions Drill 2, Problem 3. After 10 minutes of walking, how far apart are they?
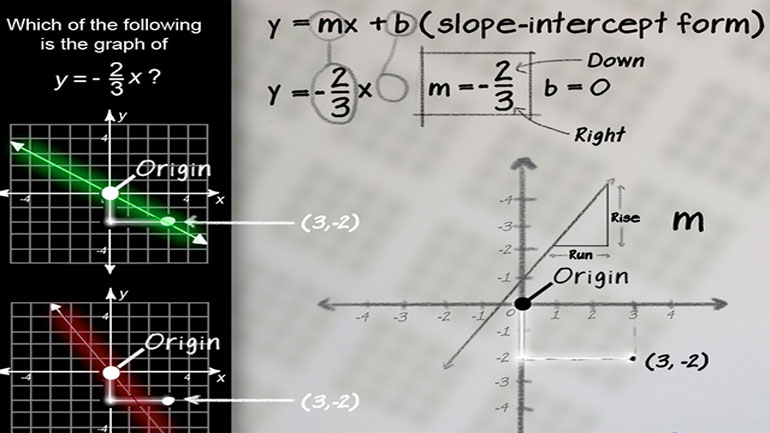
Algebra and Functions: Drill Set 4, Problem 4. Which of the following is the graph of the expression?
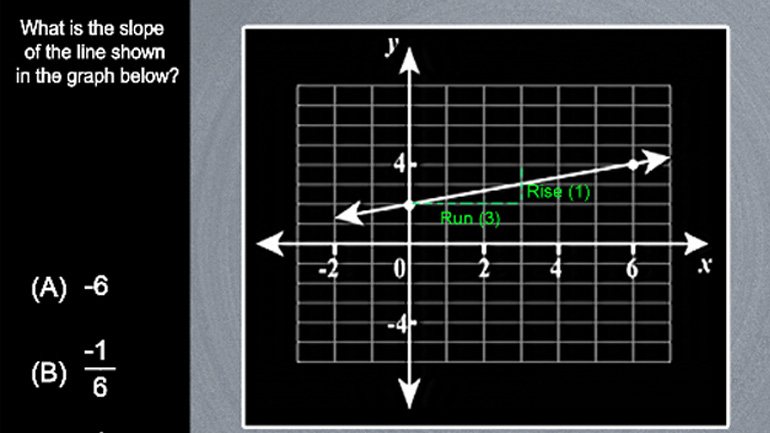
Algebra and Functions: Drill Set 4, Problem 5. What is the slope of the line in the graph?

Algebra and Functions: Drill Set 5, Problem 4. What would be the total cost if a person buys 15 wigs at this store?
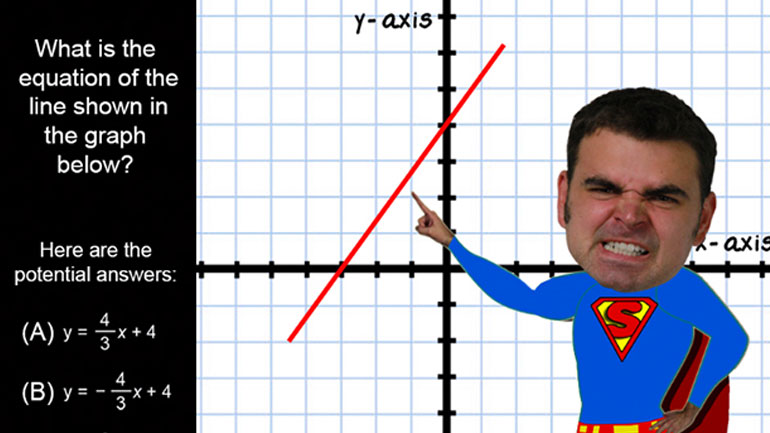
Algebra I Drill 3 Problem 4. What is the equation of the line shown in the graph?

Histograms are a neat way to organize massive amounts of related data for easy comparison and reference. If only history were this tidy.
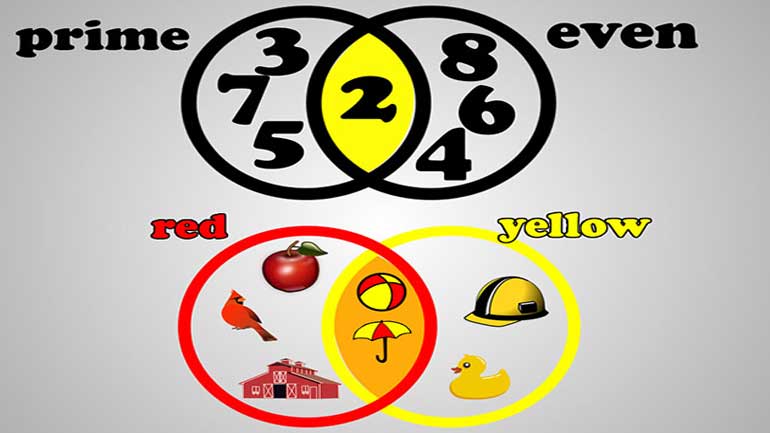
Learn about Venn diagrams with Priscilla the ugly chinchilla, as she categorizes her chinchilla friends into sets based on a survey they took.

Time to learn about univariate data and representations. We know how to get a party started.