ShmoopTube
Where Monty Python meets your 10th grade teacher.
Search Thousands of Shmoop Videos
Exploring Data Videos
Play All
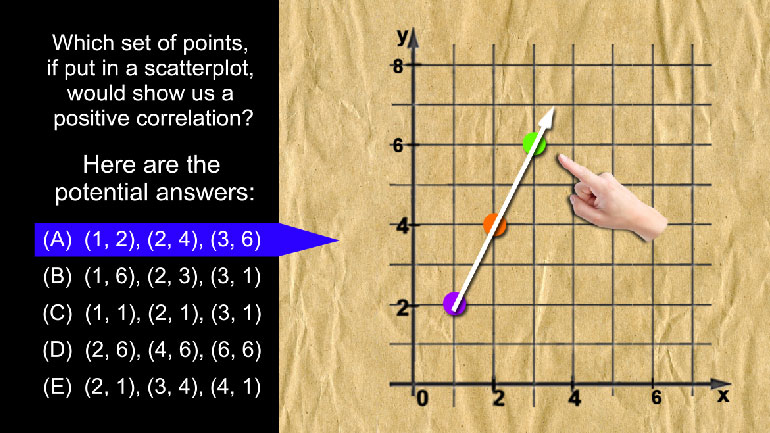
AP Statistics: Exploring Data Drill 2, Problem 3. Which set of points, if put in a scatterplot, would show us a positive correlation?

AP Statistics: Exploring Data Drill 1, Problem 2. Which of the following is the best way to display this type of data?
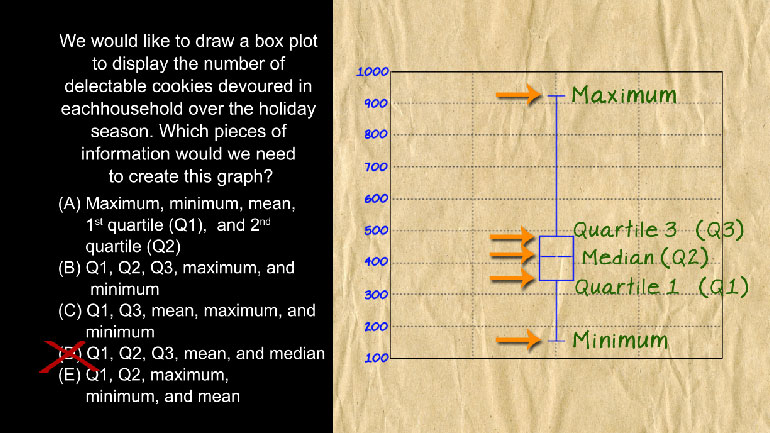
AP Statistics: Exploring Data Drill 1, Problem 5. Which pieces of information would we need to create this graph?

AP Statistics: Exploring Data Drill 2, Problem 4. This coefficient shows a relationship of...what?

AP Statistics: Exploring Data Drill 3, Problem 1. What does this information tell us?

AP Statistics: Exploring Data Drill 3, Problem 3. What is the interquartile range?

AP Statistics 2.5 Exploring Data. Which of the following is an example of bivariate categorical data?

AP Statistics 1.1 Exploring Data. What should this histogram always be?

AP Statistics 1.3 Exploring Data. The distribution of the data is what?

AP Statistics 1.4 Exploring Data. For any collection of data, the mean must equal the median if the distribution is which of the following?
AP Statistics 4.2 Exploring Data. The linear correlation coefficient r, takes values in what range?
AP Statistics 5.4 Exploring Data. Comparing two cumulative distributions, displaying the lifespans of male and female spiders, easily shows us what?
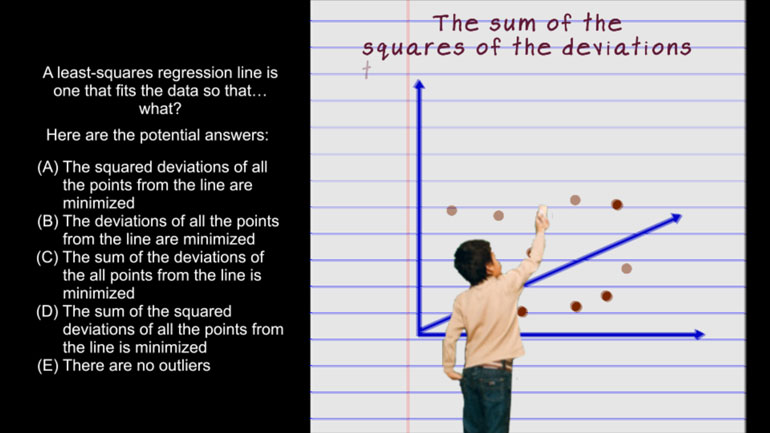
AP Statistics 4.1 Exploring Data. A least-squares regression line is one that fits the data so that...what?
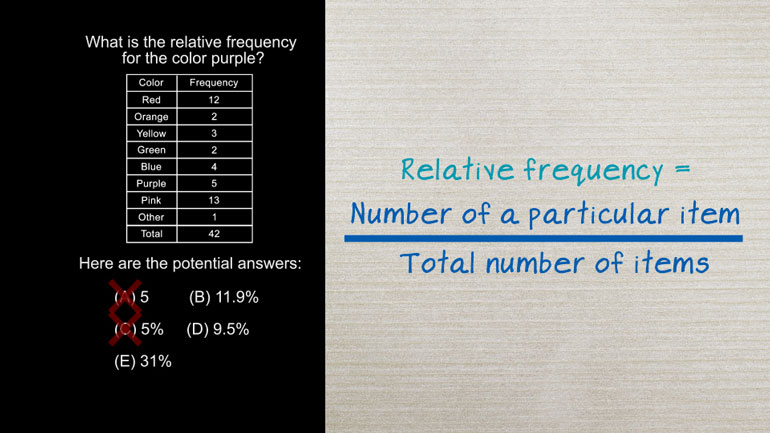
AP Statistics 5.5 Exploring Data. What is the relative frequency for the color purple?

AP Statistics 4.3 Exploring Data. We would love it if our linear correlation coefficient were what?
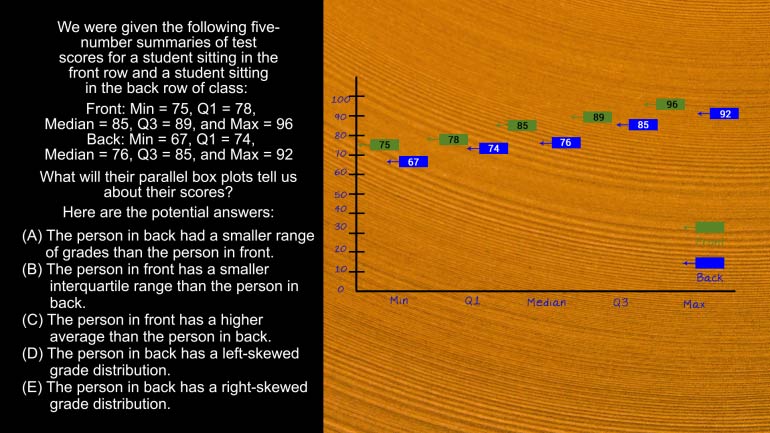
AP Statistics 5.3 Exploring Data. What will their parallel box plots tell us about their scores?
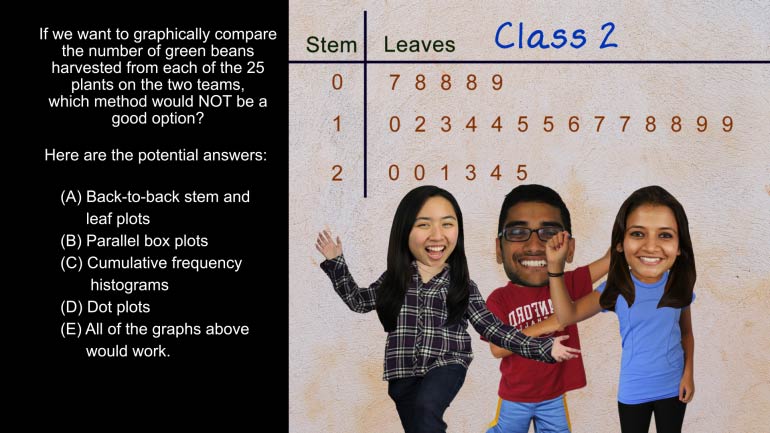
AP Statistics 5.2 Exploring Data. Which method would not be a good option?
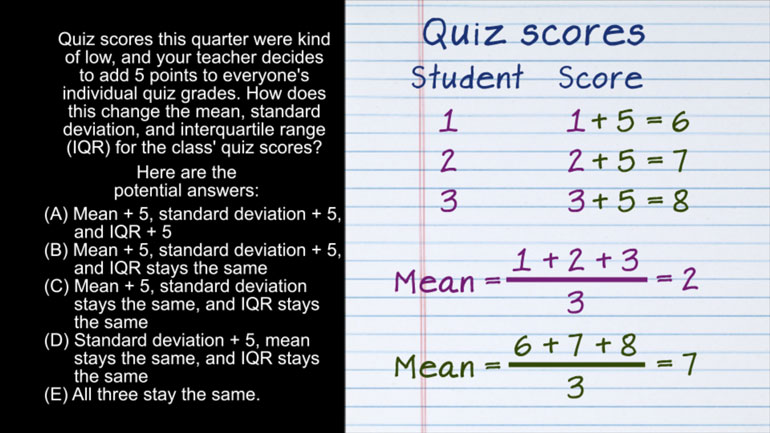
AP Statistics 2.1 Exploring Data. How does this change affect the mean, standard deviation, and IQR?
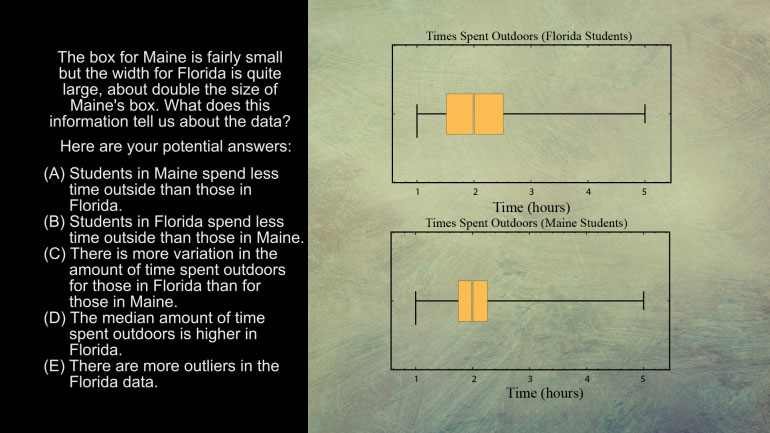
AP Statistics 5.1 Exploring Data. What does this information tell us about the data?
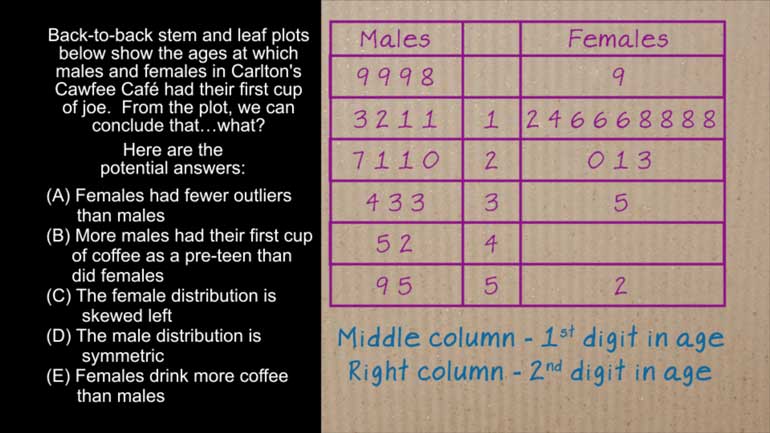
AP Statistics 4.5 Exploring Data. What can we conclude from the plot?