ShmoopTube
Where Monty Python meets your 10th grade teacher.
Search Thousands of Shmoop Videos
Data Representation Passage Videos
Play All

ACT Science: Data Representation Passage Drill 1, Problem 1. What do the statistics in Figure 1 suggest?

ACT Science: Data Representation Passage Drill 1, Problem 2. Which of the following is a variable in Figure 1, but not in Figure 2?
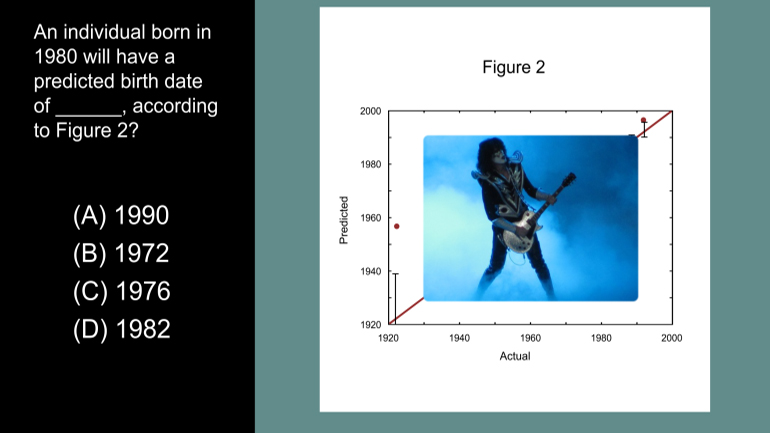
ACT Science Data Representation Passage: Drill 3, Problem 5. According to Figure 2, what birth date will be predicted for an individual actual...
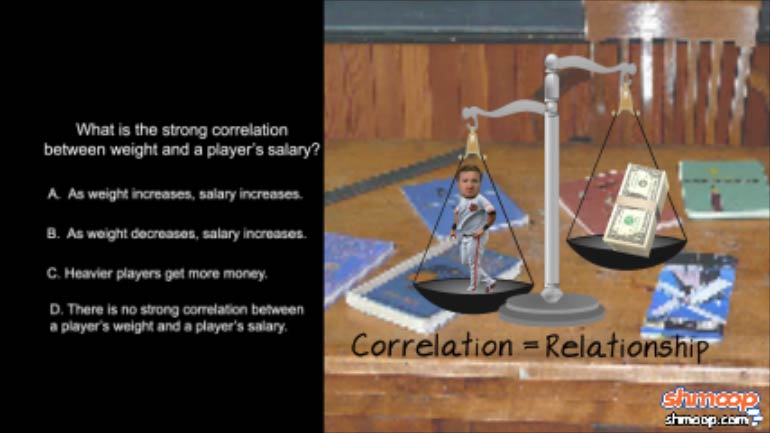
ACT Science: Data Representation Passage Drill 1, Problem 3. What is the strong correlation between weight and a player's salary?
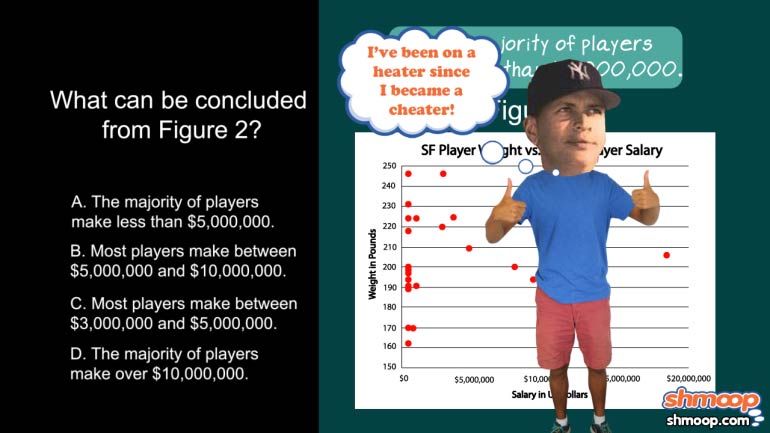
ACT Science: Data Representation Passage Drill 1, Problem 4. What can be concluded from Figure 2?
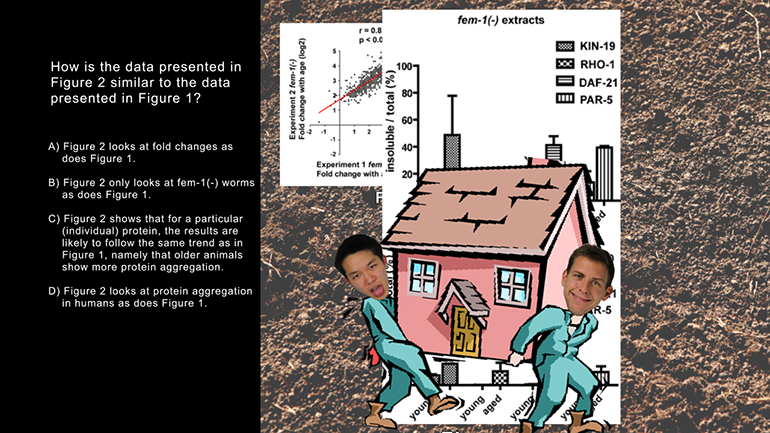
ACT Science: Data Representation Passage Drill 2, Problem 6. How is the data presented in Figure 2 similar to the data presented in Figure 1?
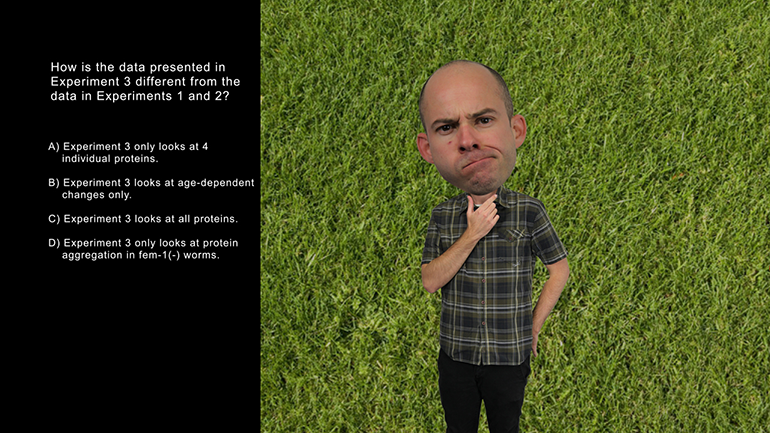
ACT Science: Data Representation Passage Drill 2, Problem 7. How is the data presented in Experiment 3 different from the data in Experiments...

ACT Science: Data Representation Passage Drill 1, problem 7. Why is this student mistaken?

ACT Science: Data Representation Passage Drill 1, Problem 5. How does this average salary compare to the average salary in Figure 1?
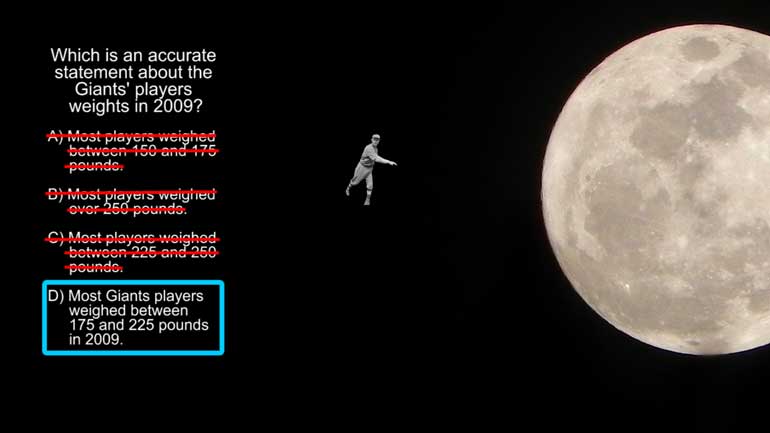
ACT Science: Data Representation Passage Drill 1, Problem 8. Which is an accurate statement about the Giants' players weights in 2009?
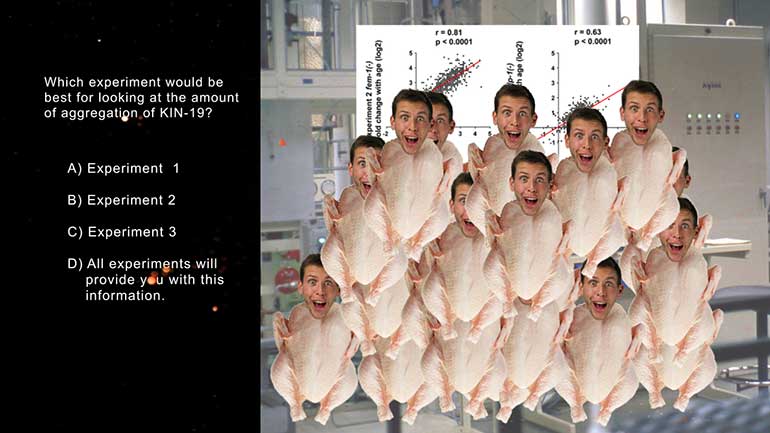
ACT Science: Data Representation Passage Drill 2, Problem 8. Which experiment would be best for looking at the amount of aggregation of KIN-19?

ACT Science: Data Representation Passage Drill 1, Problem 6. What comparison can be made between the minimum salary and the average salary of...

ACT Science: Data Representation Passage Drill 2, Problem 1. What does each of the dots on the first two graphs in Figure 1 represent?
ACT Science: Data Representation Passage Drill 2, Problem 10. If research done in worms were to directly apply to humans, what is likely to be...
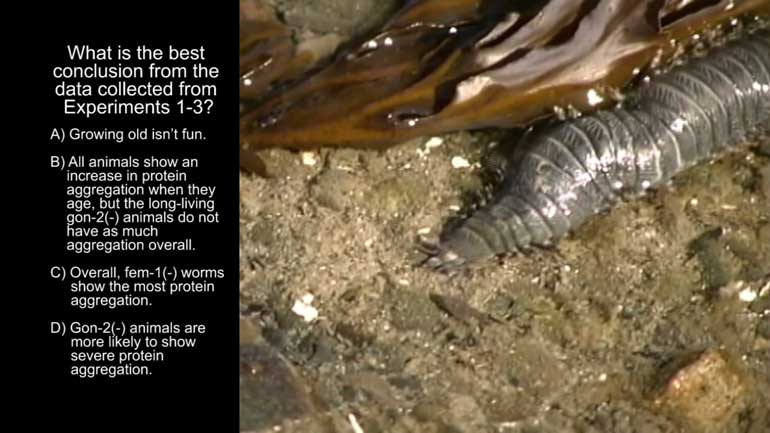
ACT Science: Data Representation Passage Drill 2, Problem 9. What is the best conclusion from the data collected from Experiments 1-3?
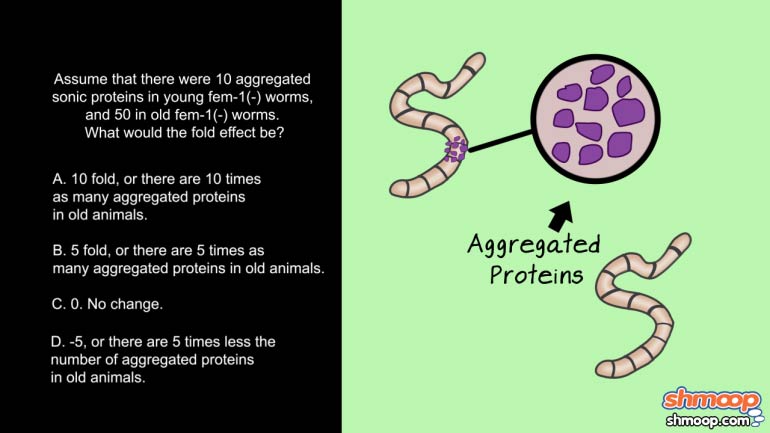
ACT Science: Data Representation Passage Drill 2, Problem 5. What would the fold effect be?

ACT Science: Data Representation Passage Drill 3, Problem 4. Which of the following best describes the change in atmospheric 14C after 1965?
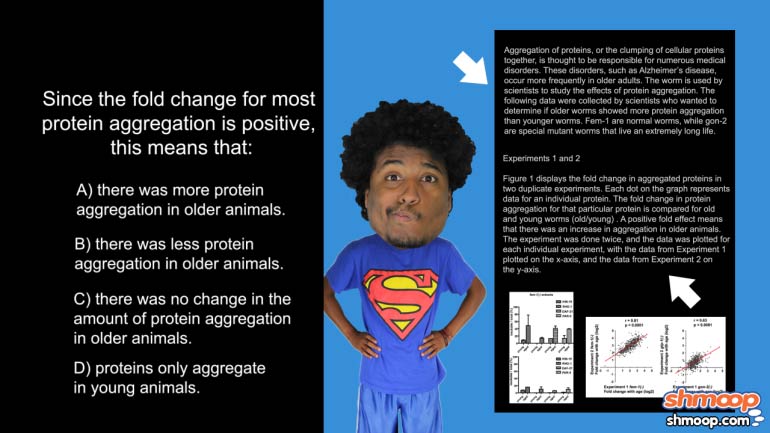
ACT Science: Data Representation Passage Drill 2, Problem 4. Since the fold change for most protein aggregation is positive, this means that.....
ACT Science: Data Representation Passage Drill 1, Problem 9. Which of the following ideas can be supported by Figure 2?

ACT Science: Data Representation Passage Drill 1, Problem 10. What do the statistics in Figure 1 suggest?