ShmoopTube
Where Monty Python meets your 10th grade teacher.
Search Thousands of Shmoop Videos
Statistics, Data Analysis, and Probability 7 Videos
Statistics, Data, and Probability II Drill 1, Problem 2. Based on the chart, which of the following statements is true?
Representing Videos 6 videos


Statistics, Data, and Probability II Drill 1, Problem 2. Based on the chart, which of the following statements is true?

CAHSEE Math Statistics, Data, and Probability II: Drill Set 1, Problem 3. Based on the following, which of the following statements is true?

Statistics, Data, and Probability II: Drill Set 1, Problem 4. Which of the following pie charts correctly represents the data given in the table?
Scatterplots Videos 9 videos


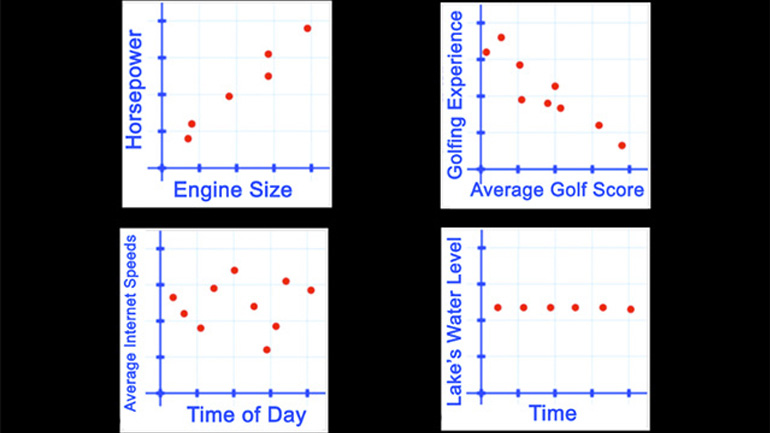
Statistics, Data, and Probability II Drill 4 Problem 1. Which of the following scatter plots represents a negative correlation between the data sets?
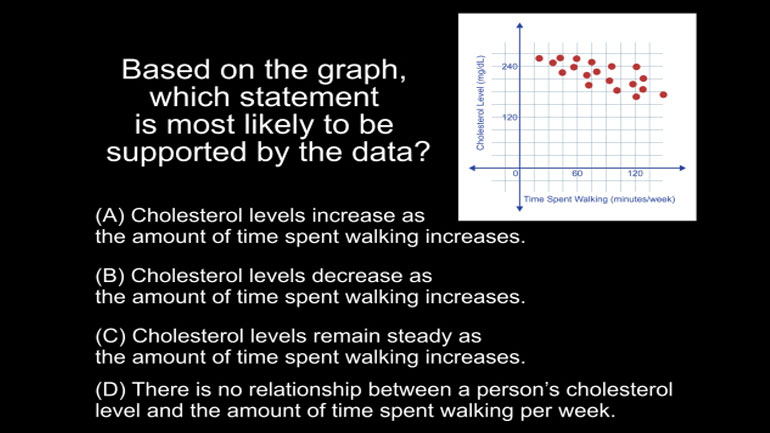
Statistics, Data, and Probability II Drill 4 Problem 2. Based on the graph, which statement is most likely to be supported by the data?
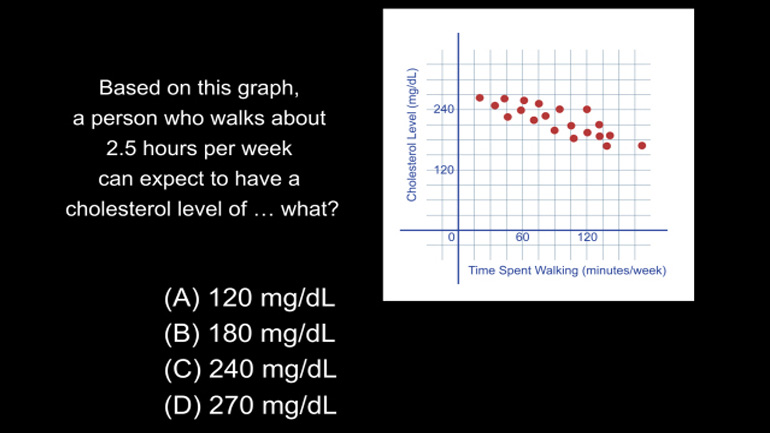
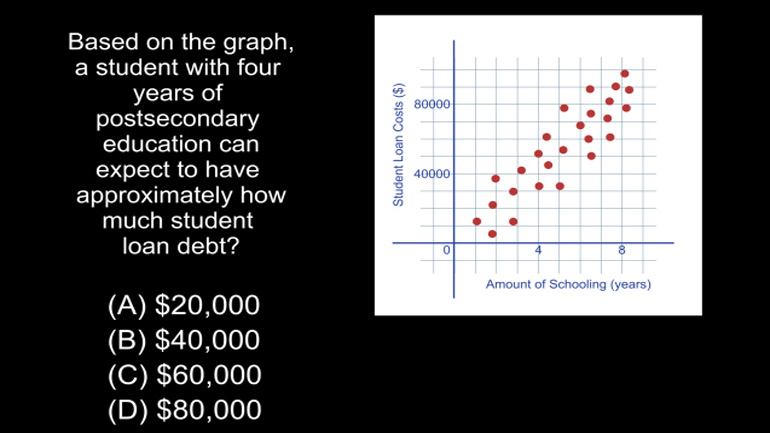
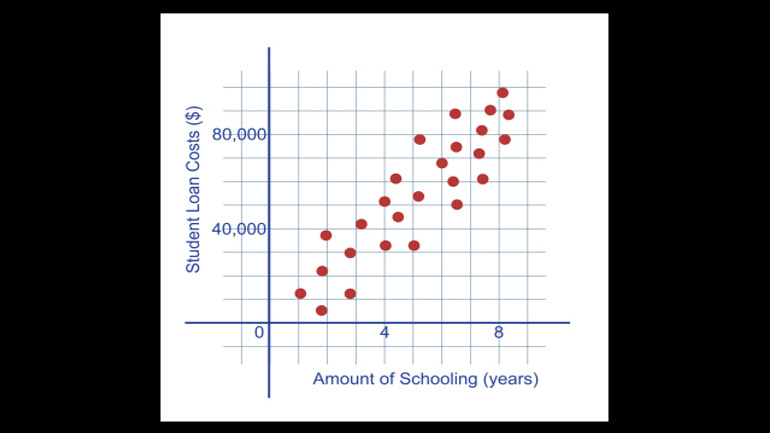
Statistics, Data, and Probability II Drill 4 Problem 3. Based on this graph, a person who walks about 2.5 hours per week can expect to have a...