ShmoopTube
Where Monty Python meets your 10th grade teacher.
Search Thousands of Shmoop Videos
TSI Math: Which Frequency Table Matches the Data Set? 40 Views
Share It!
Description:
Walker recorded the shoe sizes of every member of her extended family. Her data is shown below in list form. Which frequency table matches her data?
5, 5, 8, 8, 8, 9, 9, 10, 10, 10, 10, 11, 11, 12, 14
- Data Analysis, Statistics, and Probability / Interpreting Categorical and Quantitative Data
- Data Analysis, Statistics, and Probability / Interpreting Categorical and Quantitative Data
- TSI Math / Data Analysis, Statistics, and Probability
- Test Prep / TSI
- TSI Mathematics / Data Analysis, Statistics, and Probability
- TSI / TSI Math
- TSI / TSI Mathematics
- Test Prep / TSI
Transcript
- 00:02
Okay sy mash bumpers Here go Walker recorded the shoe
- 00:05
sizes of every member of her extended family Her data
- 00:09
is shown below in list form which frequency table matches
- 00:13
her data All right so we've got a shoe size
- 00:21
here and a frequency like how many times do we
Full Transcript
- 00:23
see the shoe size over here And we're just going
- 00:27
to guess Count him up there's Not much else we
- 00:29
can do here Well lots of people in walker's family
- 00:31
have the same shoe size Wouldn't it be great if
- 00:34
we could keep track of it all in an organized
- 00:36
way as luck would have it well that's The exact
- 00:38
point of a frequency table The column on the right
- 00:40
marks how many times each shoe size repeats Well all
- 00:44
we need to do is count how many times each
- 00:45
shoe size that repeats there And we've got our answer
- 00:47
So two people wear size five shoes three people where
- 00:51
size eight two people wear size nine four people wear
- 00:55
size ten to viewers as eleven Only one person where
- 00:58
size twelve there And one person wears a fourteen year
- 01:01
that's Uncle krusty Well zero people wear sizes six seven
- 01:04
and thirteen But these air all included in the table
- 01:07
anyway Well the on ly table with the right count
- 01:10
here is a right there It's got all the right 00:01:12.599 --> [endTime] answers so that's it it's A We are shmoop
Up Next
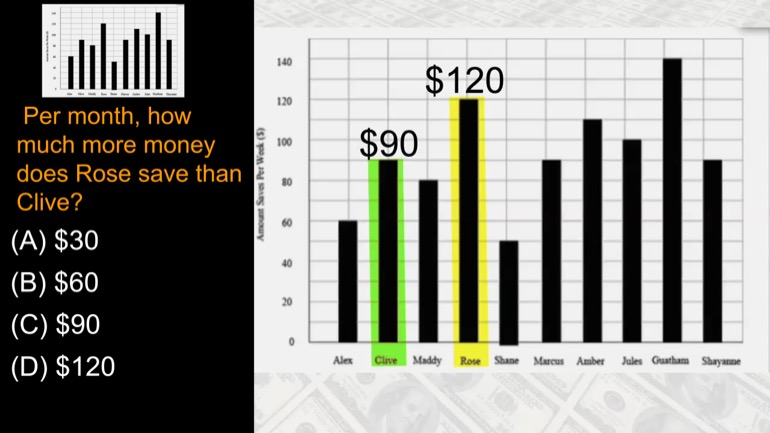
Per month, how much more money does Rose save than Olive?
Related Videos
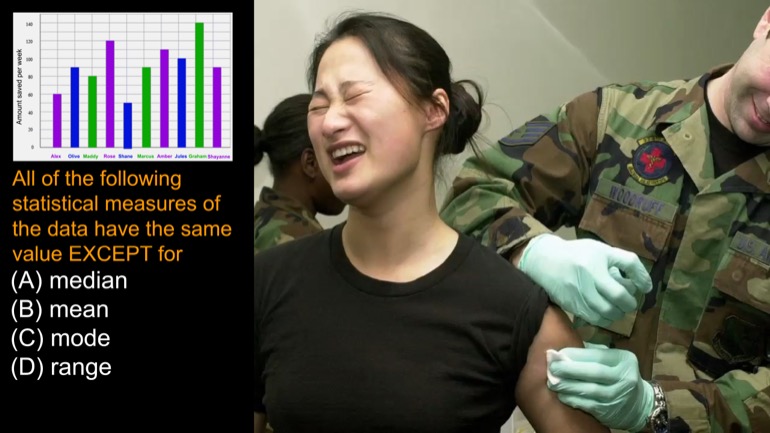
All of the following statistical measures of the data above have the same value EXCEPT for
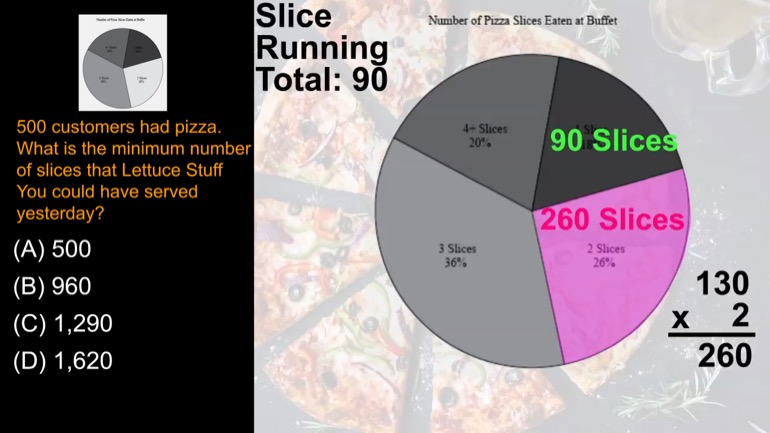
500 customers had pizza. What is the minimum number of slices that Lettuce Stuff You could have served yesterday?
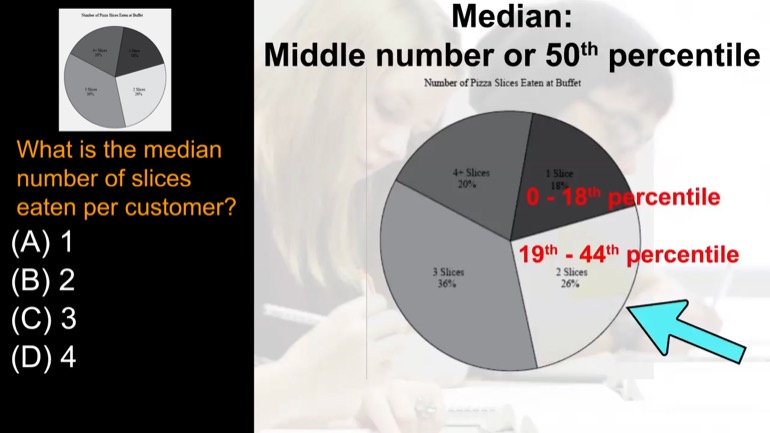
What is the median number of slices eaten per customer?
The following table shows the coffee preferences of everyone in Isabelle's office. What percentage of Isabelle's coworkers put cream in their coffee?