There is much debate about who is more awesome...right-handers or south-paws. Would you want Shoeless Joe Jackson on your team, or Nomar Garciaparra? That's why it's better to have a switch hitter like Chipper Jones at bat; we don't have to pick.
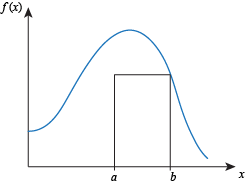
In calculus, right-hand sums are similar to left-hand sums. However, instead of using the value of the function at the left endpoint of a sub-interval to determine rectangle height, we use the value of the function at the right endpoint of the sub-interval.
As with left-hand sums we can find the values of the function that we need using formulas, tables, or graphs.
Right-Hand Sums with Formulas
If we're given a formula for the function, we can use this formula to calculate the value of the function at the right endpoint of each sub-interval.
Right-Hand Sums with Tables
In order to find a right-hand sum we need to know the value of the function at the right endpoint of each sub-interval. We can take a right-hand sum if we have a table that contains the appropriate function values.
Sample Problem
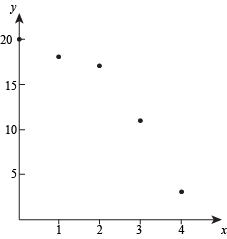
Some values of the decreasing function f (x) are given by the following table:

- Use a Right-Hand Sum with 2 sub-intervals to estimate the area between the graph of f and the x-axis on the interval [0, 4].
We don't know what the function f looks like, but we know these points are part of it:
Dividing the interval [0, 4] into 2 equally-sized sub-intervals gives us sub-intervals of length 2. The height of the rectangle on [0, 2] is f(2) = 17, so the area of this rectangle is
height ⋅ width = 17(2) = 34.
The height of the rectangle on [2, 4] is f (4) = 3, so the area of this rectangle is
height ⋅ width = 3(2) = 6.
Adding the areas of these rectangles, we estimate the area between the graph of f and the x-axis on [0,4] to be
34 + 6 = 40.
- Use a Right-Hand Sum with 4 sub-intervals to estimate the area between the graph of f and the x-axis on the interval [0, 4].
Dividing the interval [0,4] into 4 evenly-sized sub-intervals produces sub-intervals of length 1.
Sub-interval [0, 1]:
This rectangle has height f(1) = 18 and width 1, so its area is 18.
Sub-interval [1, 2]:
This rectangle has height f(2) = 17 and width 1, so its area is 17.
Sub-interval [2, 3]:
This rectangle has height f(3) = 11 and width 1, so its area is 11.
Sub-interval [3, 4]:
This rectangle has height f(4) = 3 and width 1, so its area is 3.
Adding the areas of these rectangles, we estimate the area between the graph of f and the x-axis on [0, 4] to be
18 + 17 + 11 + 3 = 49.
- Are the estimates in parts over- or under-estimates for the area between the function f and the x-axis on the interval [0, 4]?
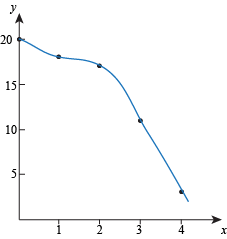
Answer. We don't know what the function f looks like exactly, but we know it's a decreasing function that passes through these points.
That means it must look something like this:
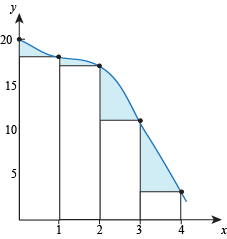
Our estimates in were both underestimates, because the rectangles didn't cover all of the area between the graph of f and the x-axis on [0, 4]:
- Could we use a right-hand sum with more than 4 sub-intervals to estimate the area between the function f and the x-axis on the interval [0, 4]?
Answer. No. The table doesn't contain enough data for us to divide the interval [0, 4] into more than 4 sub-intervals. If we tried to use 8 sub-intervals, for example, we would need to know f (0.5), and that value isn't in the table.
Right-Hand Sums with Graphs
When finding a right-hand sum, we need to know the value of the function at the right endpoint of each sub-interval. We can find these values by looking at a graph of the function.
Right-Hand Sum Calculator Shortcuts
For a LHS, we only use values of the function at left endpoints of subintervals. We never use the value of the function at the right-most endpoint of the original interval.
For Right-Hand Sums, it's the other way around. For an RHS we only use values of the function at right endpoints, so we'll never use the value of the function at the left-most endpoint of the original interval.
Right-Hand Sums with Math Notation
After learning the notation for left-hand sums, the notation for right-hand sums requires a very slight adjustment. Assume that we're using sub-intervals all of the same length and we want to estimate the area between the graph of f (x) and the x-axis on the interval [a, b].
An interval of the form [a, b] has length b – a. If we wish to divide the interval [a, b] into n equal sub-intervals, each sub-interval will have length

The endpoints of the sub-intervals are

To take a RHS with n sub-intervals we find the value of f at every endpoint but the first, add these values, and multiply by Δx.
RHS(n) = [f (x1) + f (x2) + ... + f (xn – 1) + f (xn)]Δx
Summation notation for extra fanciness is optional:

Right-Hand Sums with Sub-Intervals on Different Lengths
As with left-hand sums, we can take right-hand sums where the sub-intervals have different lengths.
Sample Problem
Values of the function f are shown in the table below. Use a right-hand sum with the sub-intervals indicated by the data in the table to estimate the area between the graph of f and the x-axis on the interval [1, 8].

Answer. The sub-intervals given in this table aren't all the same. Most of them are 2, but one is 1.
On sub-interval [1, 3] the height of the rectangle is f(3) = 5 and the width is 2, so the area is
5(2) = 10.
On sub-interval [3, 4] the height of the rectangle is f (4) = 3 and the width is 1, so the area is
3(1) = 3.
On sub-interval [4, 6] the height of the rectangle is f (6) = 5 and the width is 2, so the area is
5(2) = 10.
On sub-interval [6, 8] the height of the rectangle is f (8) = 1 and the width is 2, so the area is
1(2) = 2.
Adding the areas of the rectangles, we estimate the area between f and the x-axis on [1, 8] to be
10 + 3 + 10 + 2 = 25.
Example 1
Let R be the region between the graph f(x) = x2 + 1 and the x-axis on the interval [0, 4]:
Use a right-hand sum with two sub-intervals to approximate the area of R. |


Example 2
Let R be the region between the graph f(x) = x2 + 1 and the x-axis on the interval [0, 4]. Use a Right-Hand Sum with 4 sub-intervals to estimate the area of R. |


Example 3
Let S be the region between the graph of g and the x-axis on the interval [0, 4].
Use a right-hand sum with 2 sub-intervals to estimate the area of S. Is this an under-estimate or an over-estimate? |


Example 4
Let f(x) = 2 + x2 and let R be the region between the graph of f and the x-axis on the interval [0, 8]. Use a right-hand sum with 4 sub-intervals to estimate the area of R. |
Example 5
Let f (x) = 4x and let R be the region between the graph of f and the x-axis on the interval [1, 2]. Use a right-hand sum with 4 sub-intervals to estimate the area of R. |

Example 6
Let f (x) = 2x on [2, 10]. Find RHS(5). That is, use a right-hand sum with 5 sub-intervals to estimate the area between the graph of f and the x-axis on [2, 10]. |
 .
.


Exercise 1
Let R be the region between the graph of f(x) = x2+ 1 and the x-axis on the interval [0, 4].
- Draw R and the 8 rectangles that result from using a right-hand sum with 8 sub-intervals to approximate the area of R.
- Use a Right-Hand Sum with 8 sub-intervals to approximate the area of R.
- Is your approximation an under-estimate or an over-estimate to the actual area of R?


Exercise 2
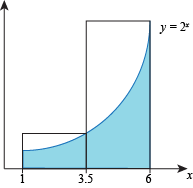
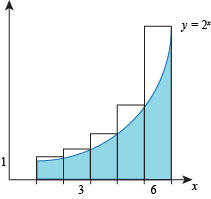
Let S be the area between the graph of y = f (x) = 2x and the x-axis on the interval [1, 6].
- Draw S.
- Use a Right-Hand Sum with 2 subintervals to approximate the area of S. Draw S and the rectangles used in this Right-Hand Sum on the same graph.
- Use a Right-Hand Sum with 5 subintervals to approximate the area of S. Draw S and the rectangles used in this Right-Hand Sum on the same graph.
- Are your approximations in parts bigger or smaller than the actual area of S?

 .
.
Exercise 3
Let W be the area between the graph of  and the x-axis on the interval [1, 4].
- Draw W.
- Use a Right-Hand Sum with 3 subintervals to approximate the area of W. Draw W and the rectangles used in this Right-Hand Sum on the same graph.
- Use a Right-Hand Sum with 6 subintervals to approximate the area of W. Draw W and the rectangles used in this Right-Hand Sum on the same graph.
- Are your approximations bigger or smaller than the actual area of W?


 .
.
 .
.


 .
.

Exercise 4
The table below shows some values of the increasing function f(x).

- Use a right-hand sum with one sub-interval to estimate the area between the graph of f and the x-axis on the interval [2, 8].
- Use a right-hand sum with three sub-intervals to estimate the area between the graph of f and the x-axis on the interval [2, 8].
- Are your answers over- or under-estimates of the actual area between the graph of f and the x-axis on the interval [2, 8]?


Exercise 5
Some values of the decreasing function g are given in the table below:

- Use a right-hand sum with 3 sub-intervals to estimate the area between the graph of g and the x-axis on the interval [-1, 2].
- Use a right-hand sum with 2 sub-intervals to estimate the area between the graph of g and the x-axis on the interval [-1, 2].
- Are your answers over- or under-estimates for the actual area between the graph of g and the x-axis on the interval [-1, 2]?

Exercise 6
- Let W be the region between the graph of f and the x-axis on the interval [-20, 20].

Use a right-hand sum with 4 sub-intervals to estimate the area of W.

Exercise 7
- Let Z be the region between the graph of g and the x-axis on the interval [-4, 0].

- Use a right-hand sum with 2 sub-intervals to estimate the area of Z.
- Use a right-hand sum with 4 sub-intervals to estimate the area of Z.
- Are your answers over- or under- estimates for the area of Z?


Exercise 8
Let f(x) = x2 + 6x + 9. Use a right-hand sum with 6 sub-intervals to estimate the area between the graph of f and the x-axis on the interval [-6,-3].

Exercise 9
Let f (x) = -x2 + 2x + 8. Use a right-hand sum with 8 sub-intervals to estimate the area between the graph of f and the x-axis on the interval [0, 4].
Exercise 10
Let g be a function with values given by the table below. Use a right-hand sum with 3 sub-intervals to estimate the area between the graph of g and the x-axis on the interval [0, 12].


Exercise 11
Let h be a function with values given by the table below. Use a right-hand sum with 9 sub-intervals to estimate the area between the graph of h and the x-axis on the interval [-9, 9].

Exercise 12
The function f (x) on the interval [0, 30] is graphed below. Use a right-hand sum with 3 sub-intervals to estimate the area between the graph of f and the x-axis on this interval.


Exercise 13
Use a right-hand sum with the sub-intervals indicated by the data in the table to estimate the area between the graph of f and the x-axis on the interval [-10,1].
