Our humps, our humps, our lovely data humps. When we go out, collect data, and graph it, it often comes out looking something like this.
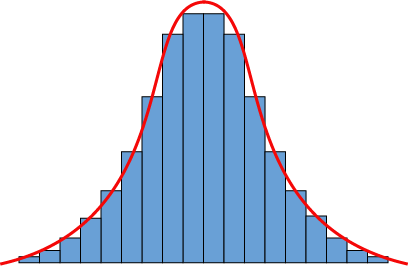
Well, we usually graph our data with a hot pink pen and doodle dragons and unicorns in the margins, but you get the idea. The data, those blue histogram bars, can be approximated by that slick curve. The most common values are in the middle of the distribution, and the absolute tippy-top of the curve, right there in the middle as well, equals the mean of the dataset.
What might we call such a curve? This is a rather popular distribution, so it has a lot of nicknames: the normal distribution is the most common, but it's also known as a Gaussian distribution or a bell-shaped curve. We think it's more hump shaped than bell shaped, but nobody asked for our opinion.
Beware the Eye of the Beholder
What is normal anyway? In real life, everybody has their quirks, oddities, and weird habits that mark them as strange in some aspect of their life. Trust us, we should know. People are just too different to pin down as strictly "normal" or "not normal." Except for that colony of clones living in the 'burbs.
In statistics, though, things are different. A dataset is normal when it follows a normal distribution. The most likely value is the mean in the middle, which also happens to equal the median and mode as well. Looks like they've made up since we last saw them. Also, a normal distribution is symmetric around the mean. Most of the data is close to the mean, and very small and very large results are equally rare.
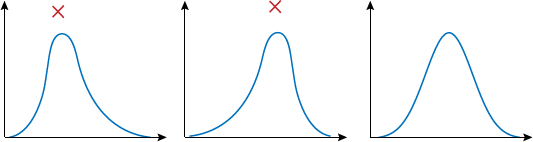
If the data is skewed too much to the side, then the mean is offset from the middle of the curve. It might look normal to some people, but not to us.
But hey, what kinds of stuff will actually be normal when we graph them? Maybe not all the things, but still a lot. People's height is one example. Some people are Andre the Giant, some people are the 7 Dwarves, but most people are somewhere in the middle.
Other types of typically normal data include yearly rainfall amounts, some Wall Street stock indices, the velocity of molecules in an ideal gas, and all kinds of measurements in astronomy, biology, physics, medicine, and whatever other subject we might care to mention.
The normal distribution sure does get around.
A Bit Spread Out
A normal distribution is completely defined by its mean and standard deviation. They have no other secrets. The mean gives its location on the x-axis, while the standard deviation tells us the shape and spread of the curve. A large standard deviation makes the curve wide and kind a flat, while a small amount of spread makes it tall and narrow.
We can know more, though. A lot more. The mean and standard deviation tell us so much, in fact, that they're going to start their own advice hotline.
Sample Problem
On average, a dress from Ye Olde Dress Shoppe costs $1250. The standard deviation for dress prices is $200, and they follow a strict normal distribution pricing scheme. What range of prices covers 95% of their inventory?
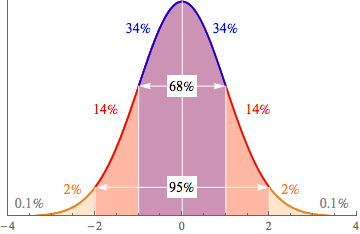
Data in a normal distribution is on a tight leash. It can't go very far from the mean in the center of the distribution. The standard deviation gives us the length of the leash, according to a handy rule of thumb called the Empirical Rule:
- About 68% of the data are within 1 standard deviation of the mean. That's about ⅔ of the data.
- About 95% of the data are within 2 standard deviations of the mean. That's most of the data.
- About 99.7% of the data are within 3 standard deviations of the mean. Good golly that's a lot of data.
This is also called the 68-95-99.7 Rule, but that isn't very catchy. It's nice to look at, though.
The Shoppe keeps their prices normally distributed, so we know that 95% of their prices will be within 2 standard deviations above or below the mean.
$1250 ± $200
= $1050 and $1450
Those prices are a bit too rich for our blood. And it doesn't look like we'll have much luck finding a bargain sale. Only 5% of the dresses will be outside of that price range, and half of that 5% will be even more expensive. We'll stick to the shops without the extra 'pe' at the end.
The Shape of Things
The Empirical Rule only works when the data is actually normal. We'd think that would be obvious, but sometimes people just assume their data comes from a normal distribution without checking. So, don't do that.
A dataset's distribution can be skewed to the side, have multiple humps, or contain outliers. Unless we're told the data is normal, we have to check it out before we can use the Empirical Rule. Or any other rule that depends on having a normal distribution, we guess.
The Name of Things
The normal distribution has too many names already, and now we need to learn two more. The mean and standard deviation both have new symbols that they go by. The mean of a normal distribution is μ; that's called mu, and it's pronounced "mew." The standard deviation of a normal distribution is σ; we call that sigma, and we pronounce it "sigma."
These names only apply when we're talking about the mean and standard deviation of a normal distribution. When we are talking about our data, we'll still use x and s. Nothing else is changed about them. They just walk around in their funny costumes, and expect us not to laugh. It's very hard not to sometimes, though.