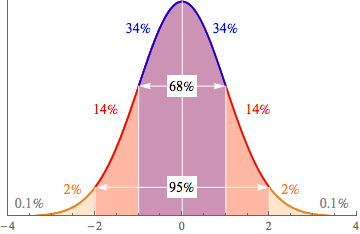
So far we've been talking about the normal distribution, but that's like talking about the chocolate chip cookie recipe. There are a lot of ways to bake yummy cookies, and there are a lot of normal distributions out there.
If the mean is 5 and the standard deviation is 10, that's a different distribution from x being 300 and s being 20. You don't even want to know what happens when the mean stops being polite and the standard deviation starts getting real.
This is important when we want to find some probabilities associated with our data. Sometimes we get lucky, and we can use the Empirical Rule to find a probability. If 68% of the data falls within 1 standard deviation of the mean, that's the same as saying that there is a 68% chance of a random data point being from that region of the graph. But life isn't always that kind.
What if our data is 0.5 standard deviations below the mean? Or 2.7 above it? Or, dare we even say it, what if we don't know how many standard deviations away from the mean we are? That may not sound like a big deal to you, but the idea makes any statistician quake in their square boots.
The probability problem is solved by using the standard normal distribution. You wouldn't recognize it passing by on the street, but it's a very special normal distribution: it has a mean of 0 and a standard deviation of 1. When x = 1, we are 1 standard deviation above the mean of a standard normal distribution.

Sound familiar? It's just like the graph of the Empirical Rule we've seen before. Take any normal distribution you care to imagine—if we move x standard deviations away from the mean, we can move x away from 0 on the standard normal distribution. It's like some wacky mirror-movement hijinks up in here.
Our secret weapon for moving from a normal distribution to the standard normal one is the formula for the Z-score.

So, if the number of hot dogs someone can eat in 10 minutes is normally distributed, with a mean of 5 and a standard deviation of 2, we can find Z for any number of hot dogs that we like. For Z = 2:

= -1.5
Only eating two hot dogs is kind of weak sauce. That's 1.5 standard deviations below the mean. The thing is, that's true for both the original distribution and the normal distribution. We expect better from a professional hot dog eater.
We're going to use this fact to calculate some probabilities for the original distribution. Not the hot dog facts, the other one. But we're going to do that later. Not now. Now is the time on Shmoop when we dance.