So, you already know about functions. They sit there, looking all y = f(x), showing a relationship between the variables x and y. We also have this quadratic equation just sitting here, not doing anything. How about we mash these two concepts together, all Frankenstein-style?

With a dramatic crash of thunder, we have:
f(x) = ax2 + bx + c
A quadratic function. Dun dun dunnnn.
What do we do with functions? We graph them, of course.
Sample Problem
Graph the quadratic function f(x) = x2.
We start off by finding a few ordered pairs and putting them in a table.
| x | f(x) |
| 0 | 0 |
| 1 | 1 |
| -1 | 1 |
| 2 | 4 |
| -2 | 4 |
| 3 | 9 |
| -3 | 9 |
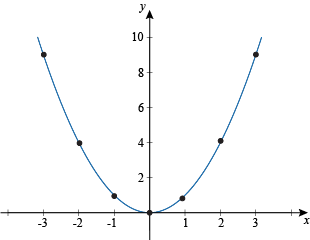
By finding even more points, we could show that the graph will continue to curve upwards, reaching larger and larger values of y for the next value of x. In fact, we'll show that with our next…
Sample Problem
Graph the quadratic function f(x) = -2x2 + x + 10.
Again we start off by finding a few points to get an idea about the general shape of the graph.
| x | f(x) |
| 0 | 10 |
| 1 | 9 |
| -1 | 7 |
| 2 | 4 |
| -2 | 0 |
| 3 | -5 |
| -3 | -11 |
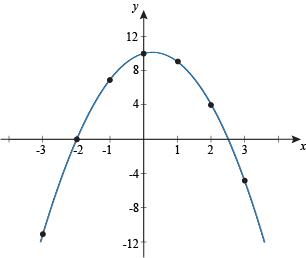
Now this graph looks similar to the previous one, but it's curved down. Both of these graphs, and all others made by quadratic functions, are called parabolas. In addition to their good looks, all parabolas share several other common features.
- They have a single maximum or minimum point, called the vertex. The first graph above has a minimum and always increases in both directions away from the vertex, while the second graph has a maximum and is always decreasing.
- Parabolas also have good posture, so they're always symmetric across some vertical line x = h, with the axis of symmetry passing through the vertex (h, k).
- All parabolas have one y-intercept, but parabolas can have 0, 1, or 2 x-intercepts.
Sample Problem
Graph the quadratic function f(x) = -x2 + 8x – 10.
Another day, another table.
| x | f(x) |
| 0 | -10 |
| 1 | -3 |
| -1 | -19 |
| 2 | 2 |
| -2 | -30 |
| 3 | 5 |
| -3 | -43 |
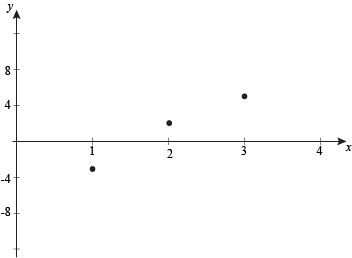
That…doesn't look too good. This is a quadratic function, so we know that the graph should look like a parabola. We must be missing some crucial points. As x becomes more negative, the values of y become lower and lower, so the vertex must be to the right of what we have already. Some experimentation finds:
| x | f(x) |
| 4 | 6 |
| 5 | 5 |
| 6 | 2 |
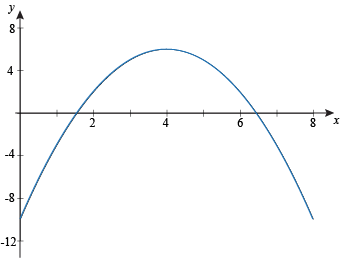
That looks better. In the next few sections, we'll learn some handy tricks for graphing parabolas that'll make things loads easier.