The difficulty of graphing a quadratic function varies depending on the form you find it in. We'll start things off relatively easily.
f(x) = a(x – h)2 + k
No, we're not lying to you; that is a quadratic function. Go ahead, multiply it out.
f(x) = ax2 + (-2ah)x + (ah2 + k)
The h and k are constants, so (-2ah) and (ah2 + k) are also constants, which we could call, say, b and c. See, you can trust us, it's totally quadratic.
When you have a parabola written out like f(x) = a(x – h)2 + k, it's in vertex form. With vertex form, you have several pieces of important information thrown at you right away. When you first meet someone, your first impression tends to stick with you. It's the same with this equation.
The sign of a tells you if the parabola opens up or down. If a is positive, it opens up. If a is being a Negative Nancy, the parabola opens down. You also know that the vertex of the parabola is at the point (h, k). Be careful with the sign of h, though.
Sample Problem
Graph the function f(x) = (x – 2)2 – 1.
The vertex of the parabola is at (h, k) = (2, –1). We can also see that the parabola opens upwards. We need a few more points, however. We could make a table and start plugging in values of x, but there's usually an easier way: find the intercepts of y and x (if they exist). Starting with the y-intercept, which occurs at x = 0.
f(0) = (0 – 2)2 – 1 = 4 – 1 = 3
Right on: (0, 3) is a point on our parabola. Now go for the x-intercepts, which occur when y = 0, if there are any.
0 = (x – 2)2 – 1
0 = x2 – 4x + 4 – 1
0 = x2 – 4x + 3
This quadratic equation can be factored.
0 = (x – 3)(x – 1)
So, (1, 0) and (3, 0) are also points on the parabola. Putting it all together gets us:
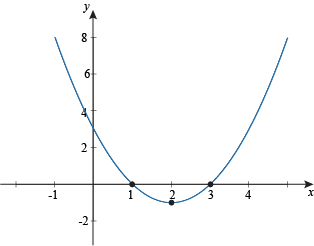
See? Math smarter, not harder.
Sample Problem
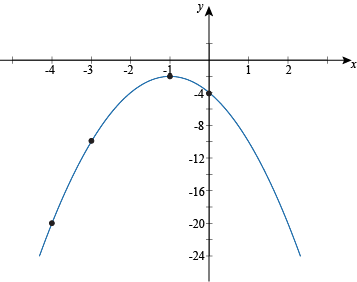
Graph the function f(x) = -2(x + 1)2 – 2.
We immediately see that the vertex is at (-1, -2), and the parabola opens down. Time to track down our y-intercept.
f(0) = -2(0 + 1)2 – 2 = -2(1) – 2 = -4
Sweet. The y-intercept is (0, -4). Now we hunt for the x-intercepts. Some say the use of dynamite while hunting is unsportsmanlike. They're probably right.
0 = -2(x + 1)2 – 2
0 = -2(x2 + 2x + 1) – 2
0 = -2x2 – 4x – 2 – 2
0 = -2x2 – 4x – 4
0 = -x2 – 2x – 2
At this point, we hit a wall. The discriminant of this equation is:
b2 – 4ac =(-2)2 – 4(-1)(-2) = 4 – 8 = -4
That's negative, so there are no real roots for this equation. This means that the function will never cross the x-axis, and so there are no x-intercepts. This makes sense given that the vertex is at (-1, -2) and the parabola points down, so the function won't go up towards the x-axis. Guess we won't need that dynamite after all.
Instead of using the x-intercepts, we'll plug in a few extra values of x and plot those.
| x | f(x) |
| -3 | -10 |
| -4 | -20 |
We're almost ready to finish off this graph. This will be easier to do with a few more points, though. Remember that the axis of symmetry passes through the vertex; we can use this to find several more points now, since we have points on both sides of the vertex.
Compare (0, -4) to the vertex at (-1, -2), for instance. It's 1 to the right on the x-axis and 2 lower on the y-axis. Because the function is symmetric, 1 space to the left of the vertex will also be 2 lower on the y-axis, at (-2, -4). Similarly, (-3, -10) is 2 spaces to the left of the vertex and 8 down, and (-4, -20) is 3 spaces left and 18 spaces down. Reflect those onto the right side of the vertex and we'll see (1, -10) and (2, -20) are also points on the parabola. Now we can confidently graph this bad boy.
Vertex Parabola Strategery
When you find yourself graphing a parabola in vertex form, here's what you do.
- Check the sign of a to see if it opens up or down.
- Find the vertex and the y-intercept.
- Determine if there are any x-intercepts, either by comparing the shape of the parabola and the vertex, or by checking the discriminant of the expanded function.
- Find the x-intercepts, if they exist.
- Check if you have enough points to finish the graph. If so, hurray.
- If not, boo. Plot a few more points, and use the function's symmetry to find more points.
- Finish up and call it a day.