Sorry, but life isn't always fair, and we have to deal with inequalities—even in math. Now we're going to cover how we deal with systems of linear inequalities. Yes, we know it's not fair. Are you giving us that look again?

Let's recap how to graph a single inequality. Then we'll ramp up to graphing systems of inequalities. We're going to limit it to graphing linear inequalities, though, and not something like apartheid. That system of inequality is a little too big to fit on one graph.
First, we ignore the inequality sign completely, and graph the line as though it had an equal sign instead.
Then we immediately stop ignoring the inequality sign, to check if it's a strict inequality or not. Our attention is fickle sometimes. Inequalities with a "<" or ">" sign are graphed with dotted lines, while inequalities with a "≤" or "≥" sign have solid lines.
Once the line is graphed, we check points to see which region of the graph satisfies the inequality, and then shade in that region. It's shady work, but someone has to do it.
That's the scoop on graphing a single linear inequality. Graphing a system of them isn't actually that different. Let's go through one.
Sample Problem
Graph the system of inequalities.
2x – y ≤ -4
x + y < 4
Our first step is to get each inequality graphed. We recommend doing it on the same coordinate plane. We're going to start off with each line graphed separately, though, just to make things easier on the eyes.
First we'll graph 2x – y ≤ -4. We have it in standard form, so it's easy to find the intercepts. The y-intercept, when x = 0, is:
2(0) – y = -4
y = 4
(Remember, we're ignoring the inequality for now.) Similarly, the x-intercept is:
2x – 0 = -4
x = -2
Okay, we we'll stop ignoring the inequality sign now. You can stop holding your breath, ≤. Anyway, this type of inequality is graphed with a solid line.

We aren't done yet, though, because we need to shade the parts where the inequality is true. We'll use (0, 0) as our test point.
2x – y ≤ -4
Is 2(0) – 0 ≤ -4? No, it's not. Shade the other side of our line.

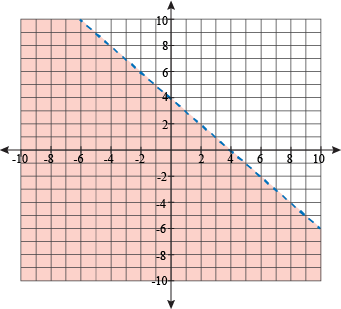
Now we'll repeat that procedure with our other graph, x + y < 4.
Both intercepts equal 4, making this a lot easier. Not 1 + 1 = 2 kinds of easy, but still.
This inequality here is strict. If you're late for dinner by a minute, you'll get no dessert and be sent off to bed early. Jeez, calm down, inequality. We'll use a dotted line if it'll make you happy.

To get the right shading, we'll test the point (0, 0) again. Honestly, we're starting to think (0, 0) likes being tested on. It's kinda weird.
Is 0 + 0 < 4? Yes, so we shade the left side of the line.
Okay, we've graphed both inequalities. What now? Smash them together and see what survives?
Actually, yes. We'll put both lines—and their shading—on the same graph. Any solution to the system needs to satisfy both individual equations. That means any place on the graph where the shades overlap (or has a solid line and shading). We suggest using two different colors for each line. How about hot pink over fluorescent green? Just kidding. That would destroy your eyeballs.

From now on, we're just going to show the shading for the solution area.
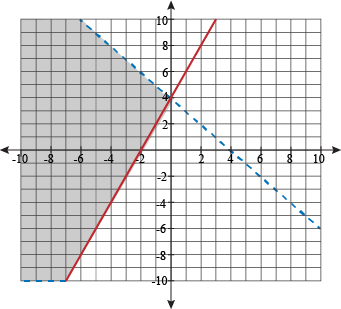
This isn't too bad. We graph both inequalities like normal, and then see where their shadings overlap. We keep the overlap and discard everything else.
Let's do another and see if we can finish it any faster. Betcha a dollar we can.
Sample Problem
Graph the system of inequalities.
y ≤ -3x + 4
x + 3y < -6
Our first equation is in slope-intercept form already. Graphing this will be easier than graphing candy from a baby. Mostly because we have no idea how you would do that.
The slope is m = -3, and we have b = 4. This is an inequality, so we also have to check if the line is dotted or solid. The line under the inequality is a sure sign of solid line-ness.

For shading purposes, we test the point (0, 0).
0 ≤ -3(0) + 4
Is 0 ≤ 4? Yes, so shade in (0, 0)'s neighborhood, to the left.

Now x + 3y < -6 is on the graphing block. The x-intercept is:
x + 3(0) = -6
x = -6
Meanwhile, the y-intercept is:
0 + 3y = -6
y = -2
The last thing we need to note is that the line is dotted, because of the "less than" sign.

Calling (0, 0) to the testing room. (0, 0), to the testing room. Please insert yourself into x + 3y < -6 and begin testing.
Is 0 + 3(0) < -6? No, negative numbers are smaller than 0. Shade the side that doesn't include (0, 0).

The shaded areas that match for both lines are what satisfy the system of inequalities.

That was a smidge quicker, we think. We can do even better, though.
Sample Problem
Solve this system of inequalities by graphing.
y ≥ x – 2
y – x < -5
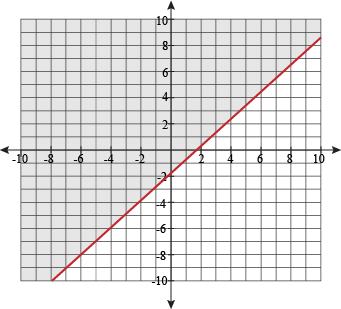
To graph the first inequality, we graph the line y = x – 2. Then, we can figure out which side of the line is included in our inequality. Remember that because we have the ≥ symbol, our line is going to be solid, not dashed.
We're in slope-intercept form already, with m = 1 and b = -2. That's enough to get us started.

What about the shading, though? Inequalities go around with wicked shades, even at night. Our old standby, (0, 0), will fill us in.
0 ≥ 0 – 2?
This is true, so we shade the side of the line with the point (0, 0), to the left.
Our second inequality, y – x < -5, is in standard form already, so we'll work with it like that. That means more interception jokes, and finding the intercepts.
y-intercept: y – 0 = -5
(0, 5)
x-intercept: 0 – x = -5
(5, 0)
Stick those in your plot and graph them. Just remember that the inequality is strict, so our line has some holes in it.

A quick plug-in of (0, 0) gives us:
0 – 0 < -5
That's not true. That's impossible!

So we shade the other side of the line. Now we can put it all together:

Well then, this is different. The shading of the two inequalities doesn't overlap; their differences are too great, the gulf between them too large. It's sad enough to make us tear up a little. We have no solutions to this system of inequalities.
Sample Problem
Graph the system of inequalities.


One more system of inequalities for the road. There are fractions in them, but they're in slope-intercept form, so that actually helps us out.
The first line,  , has a slope of
  and y-intercept of b = 4. We also know that it has a solid line. That's enough to get the graph put up.

Now to test the shading with (0, 0).
Is  ? Nope. Shade the other side of our line.

Next up is graphing  . It's very similar to the other equation, with
  , b = -4, and a solid line as well. They're not "exactly the same" kinds of similar, they just look similar.

Game time: (0, 0), we choose you. Use Test Point on the inequality.
Is  ? Uh-huh. That means we shade on the side of the origin.

Now let's pull it all together.

Just lovely. We think we've hit a world record speed run for graphing inequalities.