The x and y variables of a system of linear equations match up with the x- and y-axes on a graph. There are two variables for two dimensions. When we add in a third variable, z, that means we travel into The Third Dimension. Wooooaoooo.
Linear equations in two dimensions are represented on a graph as lines. Guess what linear equations with three variables look like on a graph? They look like planes—and not the kind with pilots.
To graph linear equations in three variables, we need to use a 3D coordinate system like the one below.
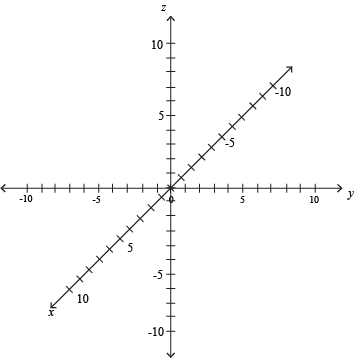
To make a 3D coordinate system, first draw a normal 2D coordinate plane like usual. Then add in a brand-spankin'-new z-axis through the origin—only it's popping out of the page in brilliant, stereoscopic 3D.
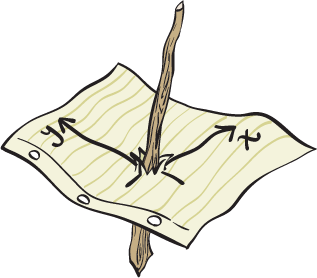
Think of it like this; x and y are lying flat, like a piece of paper on a table, and z is sticking straight up. That's much better than poking a stick through our paper to represent the z-axis. It's hard to turn in homework that way.
Sample Problem
Plot the point (-3, 1, 4).
We need to draw the coordinate system we'll be placing this point in. A point without a system to put it in is like a star without a sky. If it's not in the sky, that means it's here on Earth. That would get very hot, very quickly.
To start off, we draw our 2D plane as usual, labeling them y and z. Then, the x-axis is drawn like the line y = x. It's just easier to draw it this way, flat on a page, to give the impression of three dimensions.
For our purposes here, the positive part of the x-axis is in the lower left corner, in Quadrant III. The negative part of the x-axis is in the upper-right corner, Quadrant I. Check out the numbers; they don't lie.

Next comes putting the point on the graph. Think of the x- and y-axes as being flat on the page, and the z-axis as straight up, off the page. It can't actually grab you, though, don't worry. It might take a while to see it at first, but practice makes better.
Find the (y, z) points first, like we would x and y before, and then shift the point "forward" or "backwards" by x.
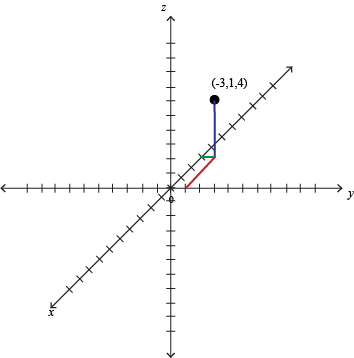
This point might look to you like it is in a weird spot. Remember, we're trying to cram three dimensions into two. A bit of awkwardness is to be expected. Again, looking at lots of different graphs will help.
Sample Problem
Graph 4x – 3y + 6z = 24.
This equation has three variables, so it represents the three-dimensional equivalent of a line: a plane. To make the graph, we'll need to make three interceptions, er, find three intercepts. Sorry, we've got football on the brain.
To find the x-intercept, plug y = 0 and z = 0 into the equation. Yep, both of them are 0 at the same time. Remember what an intercept actually is: it's the point where the equation crosses that particular axis.
4x – 3(0) + 6(0) = 24
4x = 24
x = 6
We can represent the x-intercept as an ordered triplet, (6, 0, 0). There are too many variables for it to be an ordered pair anymore. *sniff* They grow so fast at this age.
To find the y-intercept, we plug x = 0 and z = 0 into the equation.
4(0) – 3y + 6(0) = 24
-3y = 24
y = -8
This is (0, -8, 0) to its friends.
Now to find the z-intercept, the new kid on the block. Plug in x = 0 and y = 0:
4(0) – 3(0) + 6z = 24
6z = 24
z = 4
We want to plot the three intercepts: (6, 0, 0), (0, -8, 0), and (0, 0, 4). First, though, we need to draw the coordinate plane we'll be placing them on. Remember that x and y have been shuffled around.
Now for our intercepts. For x, it will be 6 points in the positive direction; that's "towards" us, along what would be y = x in a 2D graph. The y-intercept is hanging out 8 to the left, which is negative for it now. The z-intercept lies 4 point straight up.
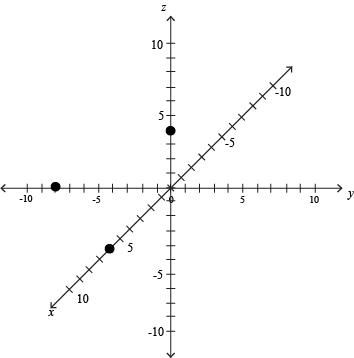
At this point, we connect the intercepts to form a triangular plane. Pretend it's a "test plane" from Area 51. Don't expect anybody to confirm its existence.
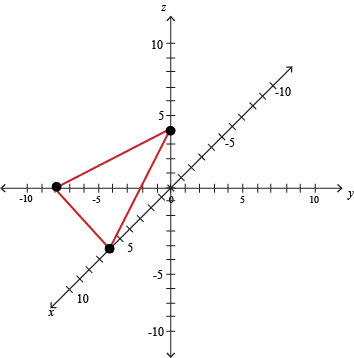
We've drawn this like a triangle, but don't be fooled. This represents just one part of the whole plane, which actually extends on and on far past where we got lazy and stopped drawing. It passes through our triangle, though.
Graphing in three dimensions is an exercise in optical illusions and imagination. And headaches, at least at first. Because paper is two-dimensional, we can't properly depict a 3D object on it. We have to trick our brains into seeing the image.
Sample Problem
Graph -10x + 5y – 10z = 20
Even though we have more variables, finding the intercepts of an equation is still a straightforward affair. Set everything but the variable of interest equal to 0.
For x we have:
-10x + 5(0) – 10(0) = 20
-10x = 20
x = -2
The y-intercept has x and z sitting on the sidelines.
-10(0) + 5y – 10(0) = 20
5y = 20
y = 4
With x and y at 0, it's up to the z-intercept to get to solve the case and save the day.
-10(0) + 5(0) –10z = 20
-10z = 20
z = -2
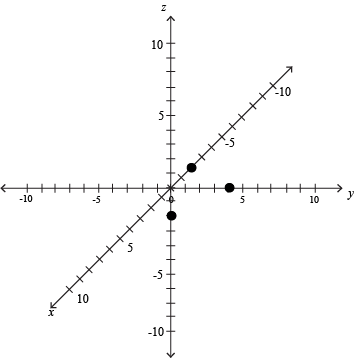
We have the points (-2, 0, 0), (0, 4, 0), and (0, 0, -2). Put 'em on the board. One point is 2 towards us, another is 4 to the right, and the last is 2 down from the origin.
Finally, connect the intercepts to form a triangular plane. Airplane noises optional.
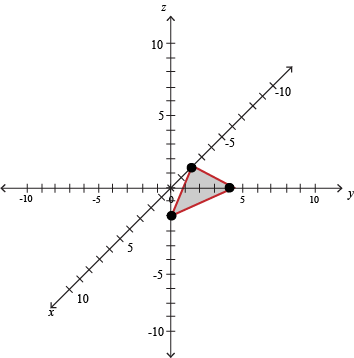
We personally think the airplane noises were crucial to our success.
Sample Problem
Graph 3x + 3y – 6z = 18
We start off by catching our three intercepts. Use any tools at our disposal: comically oversized nets, microphones, or setting the other two variables equal to 0.
To find the x-intercept, plug y = 0 and z = 0 into the equation.
3x + 3(0) – 6(0) = 18
3x = 18
x = 6
To find the y-intercept, plug x = 0 and z = 0 into the equation.
3(0) + 3y – 6(0) = 18
3y = 18
y = 6
To find the z-intercept, plug x = 0 and y = 0 into the equation.
3(0) + 3(0) – 6z = 18
-6z = 18
z = -3
Next, plot the three intercepts: (6, 0, 0), (0, 6, 0), and (0, 0, -3).
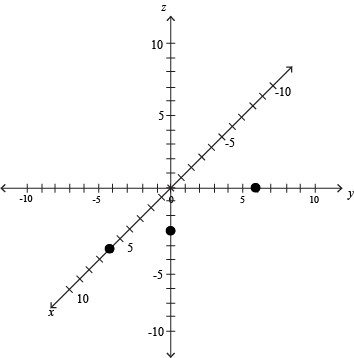
Finally, connect the intercepts to form a triangular plane.
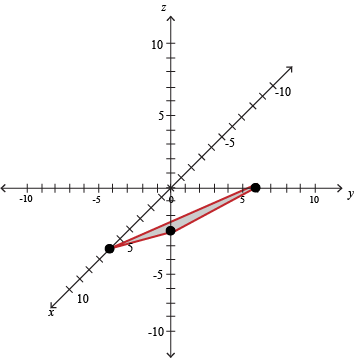
Call the captain, we've found the plane. It's still in one piece, even.