ShmoopTube
Where Monty Python meets your 10th grade teacher.
Search Thousands of Shmoop Videos
Data Representation Videos 15 videos


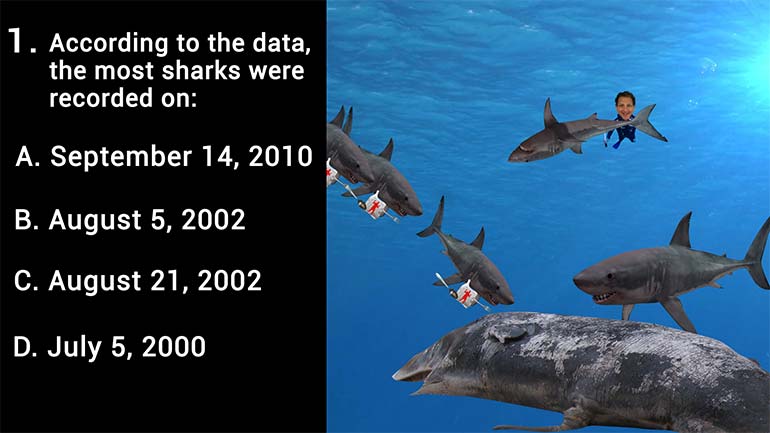
According to the data, the most sharks were recorded on:
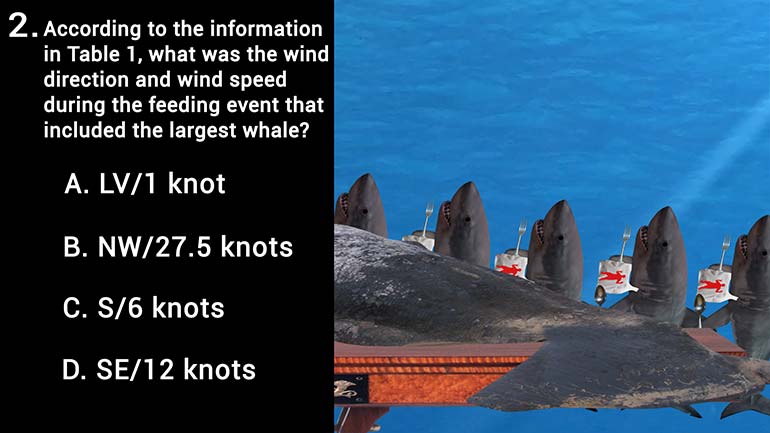
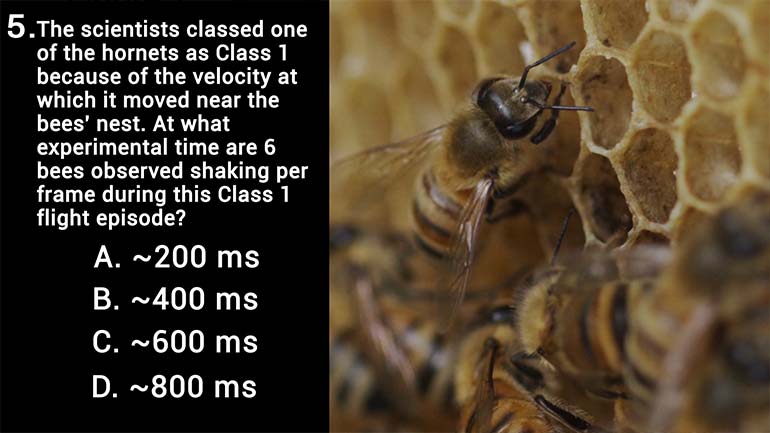
According to the information in Table 1, what was the wind direction and wind speed during the feeding event that included the largest whale?
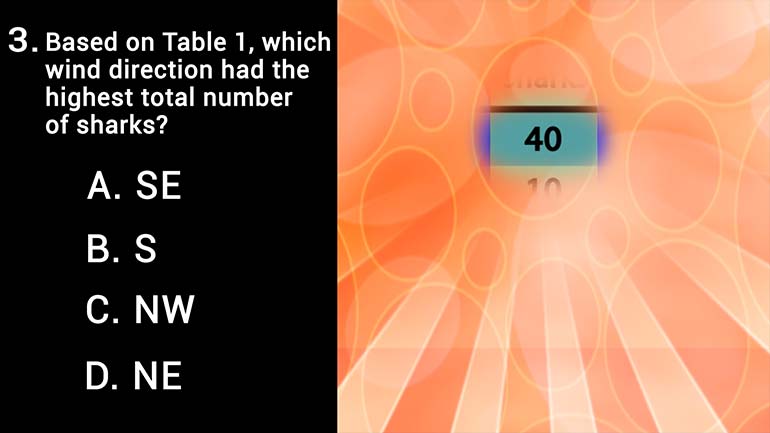
Based on Table 1, which wind direction had the highest total number of sharks?
ACT Aspire Science: Analyzing Data in Tables 9 Views
Share It!
Description:
According to the information in Table 1, what was the wind direction and wind speed during the feeding event that included the largest whale?
Transcript
- 00:00
Yeah Oh Table one below shows the recorded data from
- 00:10
each scavenging event In this study got a whale species
- 00:14
and signs of wind direction speed But really I think
- 00:18
figure one illustrates the relationship of wind speed Teo maximum
- 00:23
shark's eyes straight line and figure one is a linear
Full Transcript
- 00:26
regression fit to the data Points illustrated direct relationship between
- 00:30
wind speed and maximum shark sides according to the information
- 00:36
and Table one What was the wind direction and wind
- 00:39
speed during the feeding event that included the largest whale
- 00:47
All right Well let's say you were going back to
- 00:49
table one here and check out the column labeled size
- 00:53
leaders They're all chose the length of the observed whales
- 00:56
Right We're seeing that largest value in that column is
- 01:00
he has eighteen meaning the largest whale being feasted upon
- 01:05
during one of these shark feeding events was eighteen meters
- 01:08
long That's like a sixty ish feet Well this behemoth
- 01:12
beats the others in size by seven or eight meters
- 01:15
is a big whale and it's all we're saying This
- 01:18
is going to be one Joss a meal for the
- 01:20
sharks have found it well To find the other information
- 01:23
you stay in the same row and look at the
- 01:25
data for wind direction and wind speed and well there
- 01:29
we go in the fifth and sixth comes that's where
- 01:31
you find it And we found our answer The wind
- 01:34
is blowing heavily in a northwesterly direction at twenty seven
- 01:38
and a half Not so right there The answer is
- 01:41
B We're good or blue or whatever kind of whale
- 01:45
that is
Related Videos
According to the data, the most sharks were recorded on:
Based on Table 1, which wind direction had the highest total number of sharks?

According to the information in Figure 1, what is the maximum shark size for a wind speed of ~18 knots?
Based on the information in Figure 1, which of the following best describes the linear regression applied to the data for maximum shark size versus...

Based on the information in Figure 1, the Sharps Formation is located in which epoch?