ShmoopTube
Where Monty Python meets your 10th grade teacher.
Search Thousands of Shmoop Videos
Science Videos 45 videos


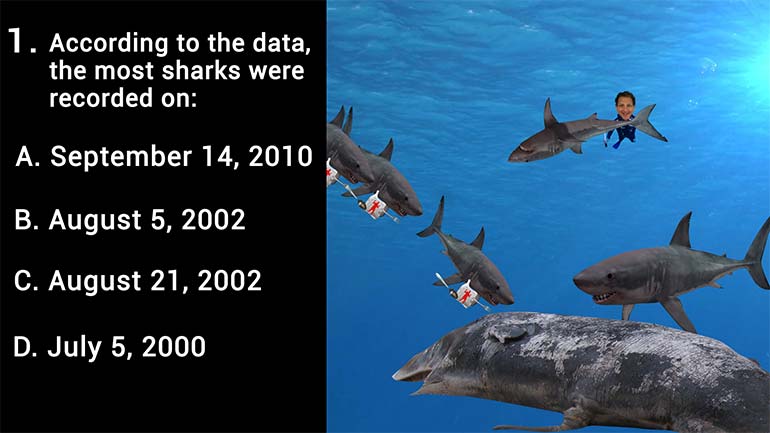
According to the data, the most sharks were recorded on:
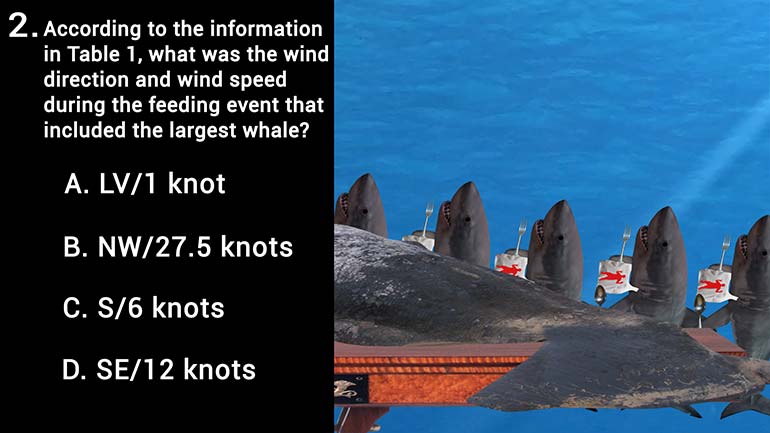
According to the information in Table 1, what was the wind direction and wind speed during the feeding event that included the largest whale?
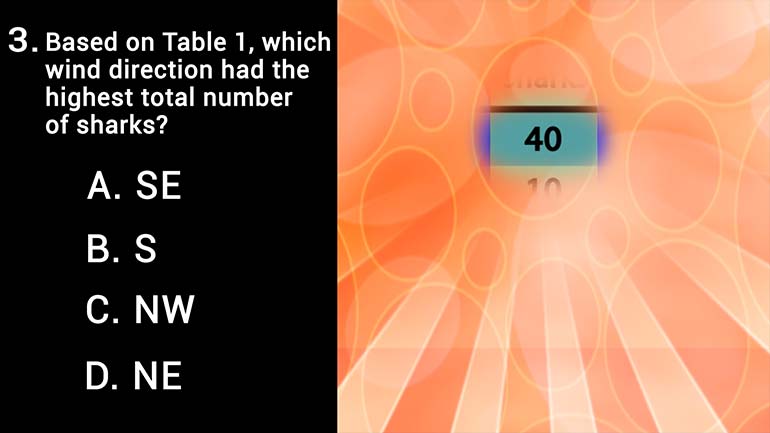
Based on Table 1, which wind direction had the highest total number of sharks?
ACT Aspire Science: Strength Values of Waves 19 Views
Share It!
Description:
Based on Figure 1, the maximum relative strength value of a small-scale wave is:
Transcript
- 00:00
Yeah Oh Okay people More weird science for you Here
- 00:06
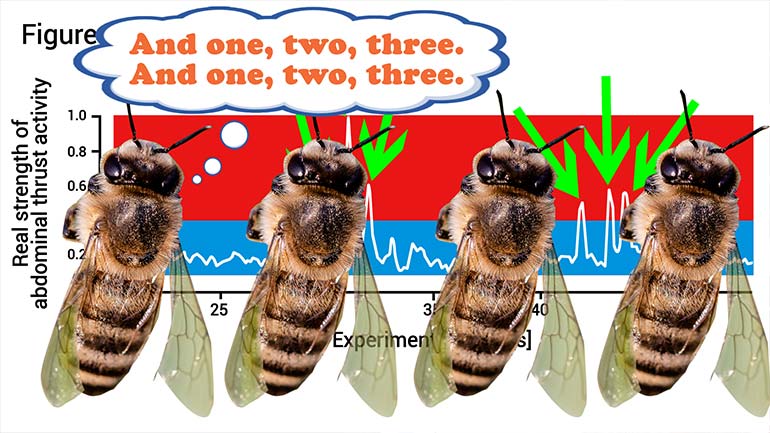
we go We'll figure one right here shows the relative
- 00:10
strength of abdominal thrust activity versus experimental time While a
- 00:16
predatory wasp is in front of the nest No small
- 00:19
scale waves are in the blue area and big scale
Full Transcript
- 00:22
waves there in the red area right now down to
- 00:24
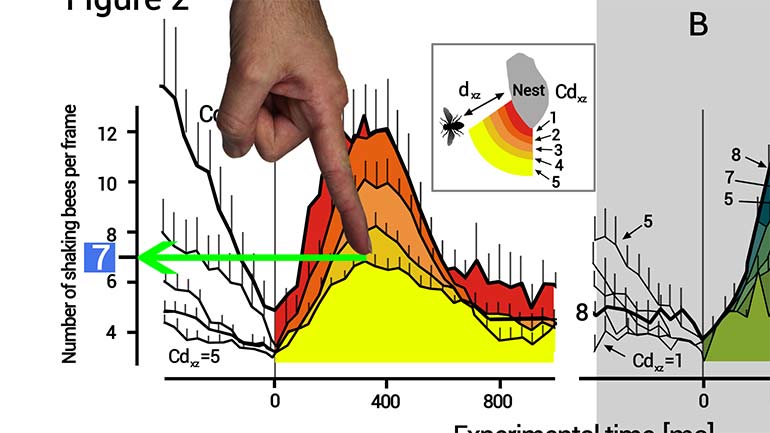
figure to right here That shows the number of shaking
- 00:27
bees per frame versus experimental time The velocities and distances
- 00:32
air split into different classes A class one distance is
- 00:36
closest to the nest and a class five distance is
- 00:40
farthest from the nest Willful velocity is split into eight
- 00:43
classes with class one being the slowest in class Eight
- 00:46
being the fastest Well the closer the hornet the higher
- 00:49
the wave strength and the faster the hornet flies past
- 00:52
the net The higher the wave strength Well the wave
- 00:56
strength is controlled by number of shaking bees I eat
- 00:59
the higher number of shaking bees The stronger the way
- 01:02
right Makes sense Okay so And then here's some detail
- 01:05
on figure one and kind of skin that if you
- 01:07
really want all right then figure to when the bees
- 01:11
and the birds and whatever Alright that's actually a different
- 01:14
course based on figure one right here This thing the
- 01:17
maximum relative strength value of a small scale wave is
- 01:22
what All right Well let's see Sometimes it's hard to
- 01:29
work up a crowd to get the A wave started
- 01:32
right There have been a football game Well these bees
- 01:34
want to get their shimmy on or rather their shimmering
- 01:38
trending but it takes them several halfhearted attempts before they
- 01:41
get there The scientists want to distinguish between low effort
- 01:45
abdominal thrusting and Mohr intense efforts right with figure caption
- 01:50
and description Tell us that the scale of waves for
- 01:54
this experiment is illustrated in the graft by the red
- 01:57
and blue areas Well the two colored areas are separated
- 02:01
at the zero point four value right there meaning that
- 02:03
the bees have to be working at forty percent of
- 02:07
full capacity to get the higher red rating you know
- 02:11
from the scientists So that's it The answer is point
- 02:13
for forty percent or B as in well be
Related Videos
According to the data, the most sharks were recorded on:
According to the information in Table 1, what was the wind direction and wind speed during the feeding event that included the largest whale?
Based on Table 1, which wind direction had the highest total number of sharks?

According to the information in Figure 1, what is the maximum shark size for a wind speed of ~18 knots?
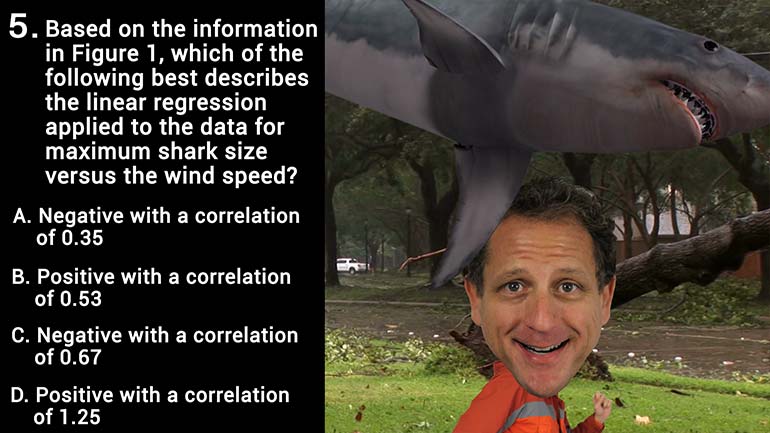
Based on the information in Figure 1, which of the following best describes the linear regression applied to the data for maximum shark size versus...