ShmoopTube
Where Monty Python meets your 10th grade teacher.
Search Thousands of Shmoop Videos
AP Microeconomics 1.6 Supply and Demand 58 Views
Share It!
Description:
AP Microeconomics 1.6 Supply and Demand. What will the production possibilities curve for this economy look like?
Transcript
- 00:00
Thank you We sneak and here's your shmoop du jour
- 00:05
Brought to you by quakers They're more than just a
- 00:07
bunch of people who sell oats They also do rice
- 00:10
cakes Assume quaker ville can produce either oats or cotton
- 00:15
And the opportunity cost of producing one unit of cotton
Full Transcript
- 00:18
in terms of boats is constant for any level of
- 00:21
production What will the production possibilities curve for this economy
- 00:25
Look like all right potential answers right Both in your
- 00:28
boat Boat boat Well we're drawn grafts now underway to
- 00:31
think through this problem So get your crayons people We
- 00:34
start with this thing mr x and mr y and
- 00:38
this vertical line covers boats and this horizontal line covered
- 00:41
cotton need to figure out if the answer is a
- 00:44
curve shaped like this This this or well this So
- 00:50
if we think through the logic of any of these
- 00:52
curves the answer should come to us in well pretty
- 00:55
straightforward fashion A curve either up or down sideways or
- 00:58
backwards is going to give uneven distribution of resource is
- 01:02
think about an extreme curve like this if we reduce
- 01:05
cotton production just a tiny bid like from here to
- 01:09
here then glam o production volumes of road explode The
- 01:13
same happens with any of the other kurt Small moves
- 01:16
of resource is on one side of the equation Have
- 01:19
dramatic changes on production availability of the other constraint Good
- 01:24
but the problem kind of gives us the answer It
- 01:27
says the opportunity cost of oats is constant for any
- 01:31
level of production constant meaning that what should happen is
- 01:36
if we moved back a scotia this way reducing cotton
- 01:39
production As we move our dot thing in toward the
- 01:42
origin then the ability to produce more oats should increase
- 01:45
similarly or constantly Well small moves this way imply small
- 01:50
moves that way So the answer is b linear and 00:01:54.032 --> [endTime] that's How we roll our oats
Up Next
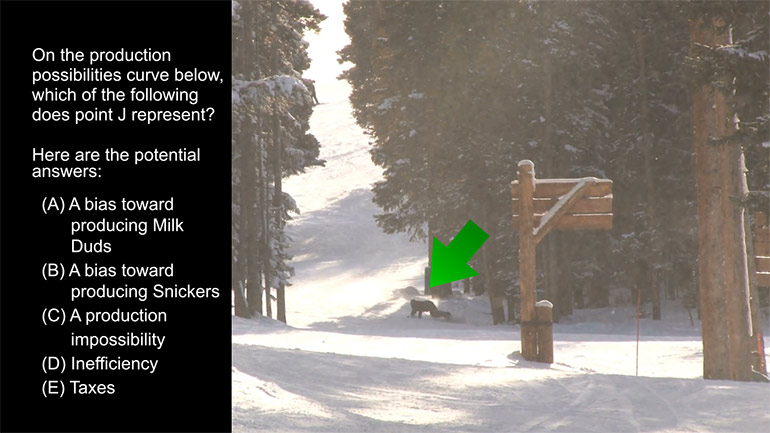
AP Microeconomics 1.6 Basic Economic Concepts Review Drill. What does this point on the production possibilities curve represent?
Related Videos
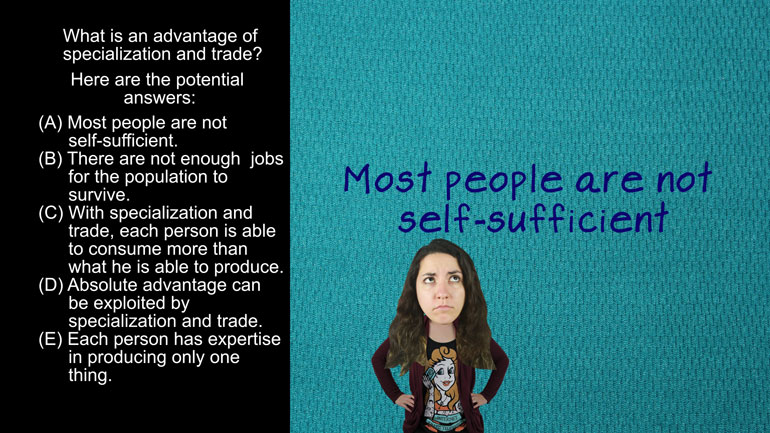
AP Microeconomics 1.12 Basic Economic Concepts. What is an advantage of specialization and trade?

AP Microeconomics 1.8 Basic Economic Concepts. What among the following may not be your opportunity cost?
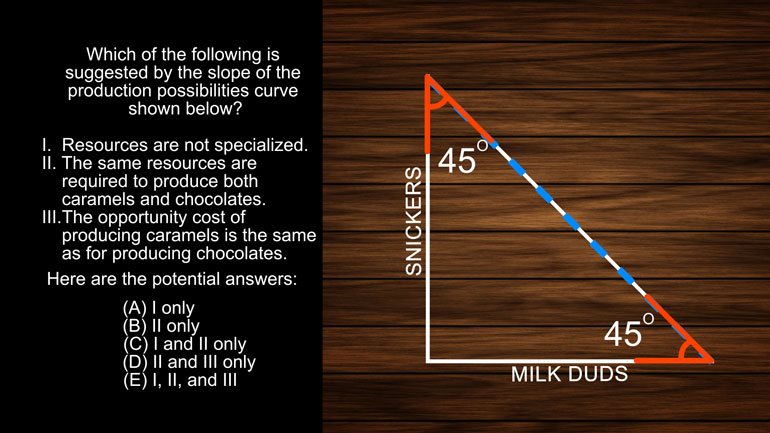
AP Microeconomics 1.4 Basic Economic Concepts. Which of the following is suggested by the slope of the production possibilities curve below?

ACT Science: Conflicting Viewpoint Passage Drill 1, Problem 1. What statement would both scientists agree upon?