ShmoopTube
Where Monty Python meets your 10th grade teacher.
Search Thousands of Shmoop Videos
Statistics and Probability Videos 134 videos


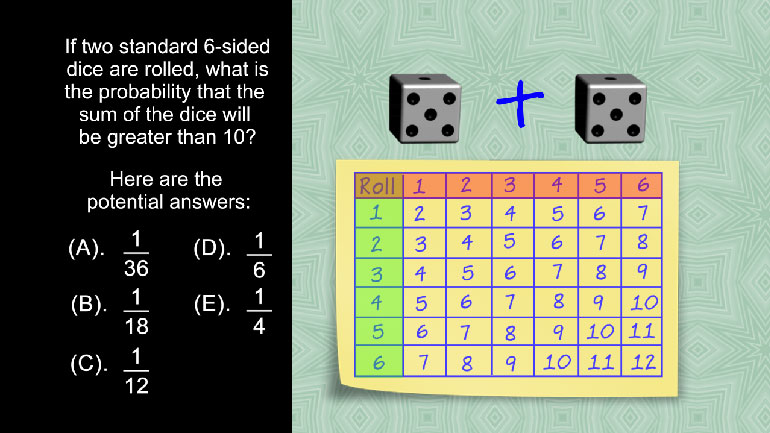
SAT Math 1.4 Statistics and Probability. If two standard 6-sided dice are rolled, what is the probability that the sum of the dice will be gre...

Unfortunately, we cannot use geometric probability to determine the chances of you enjoying this video; it can only be used with shapes. Unless you...

ACT Math: Pre-Algebra Drill 3, Problem 2. What is the probability that a red queen will be drawn?
Statistics, Data, and Probability 190 Views
Share It!
Description:
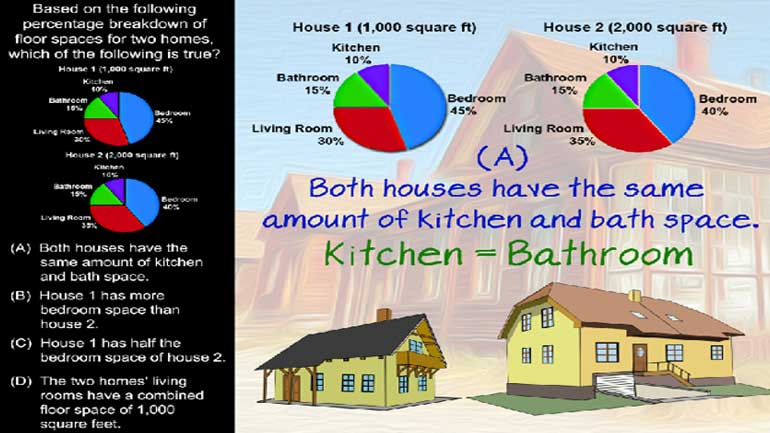
Statistics, Data, and Probability II: Drill Set 1, Problem 4. Which of the following pie charts correctly represents the data given in the table?
Transcript
- 00:03
Here's your shmoop du jour...
- 00:05
At Hogwarts, there's a raging debate about whether there are more witches or wizards on the premises.
- 00:11
The breakdown of the number of female and male students and faculty members
- 00:14
is shown below in the table.
- 00:16
Which of the following pie charts correctly represents the data given in the table?
Full Transcript
- 00:20
And here are the potential answers...
- 00:28
The question is just asking us to take a percentage of the numbers given.
- 00:31
Let's start with female students.
- 00:33
First of all, we can sum up ALL the witches and wizards to get our total population...
- 00:39
475 + 425 + 35 + 25 equals 960.
- 00:46
475 out of 960 are female students, so we divide to get a percentage.
- 00:53
475 divided by 960 is about 49 percent...
- 00:59
...and there's only one chart that matches up.
- 01:01
We can double-check by running numbers on the male students, female faculty or male faculty...
- 01:07
...but honestly, we already have our answer, and life's too short.
- 01:10
These tests are timed, and you gotta wave your wand when you can.
- 01:13
Our answer is choice A.
- 01:15
As in... "'arry Potta'!"
Related Videos

Statistics, Data, and Probability II Drill 3 Problem 2. Which two sports together make up for the preferences of more than half of all those w...

Statistics, Data, and Probability II Drill 3 Problem 3. One hundred twenty of those who were asked preferred what sport?

CAHSEE Math: Algebra and Functions Drill 5, Problem 3. Solve the equation.


Statistics, Data, and Probability I: Drill Set 3, Problem 4. How many different avatars can be created based on the given options?