ShmoopTube
Where Monty Python meets your 10th grade teacher.
Search Thousands of Shmoop Videos
Statistics and Probability Videos 63 videos


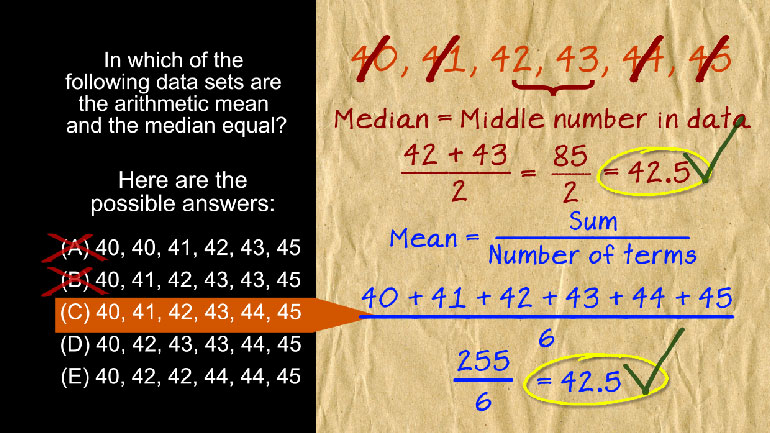
SAT Math 1.1 Statistics and Probability. In which of the following data sets are the arithmetic mean and the median equal?
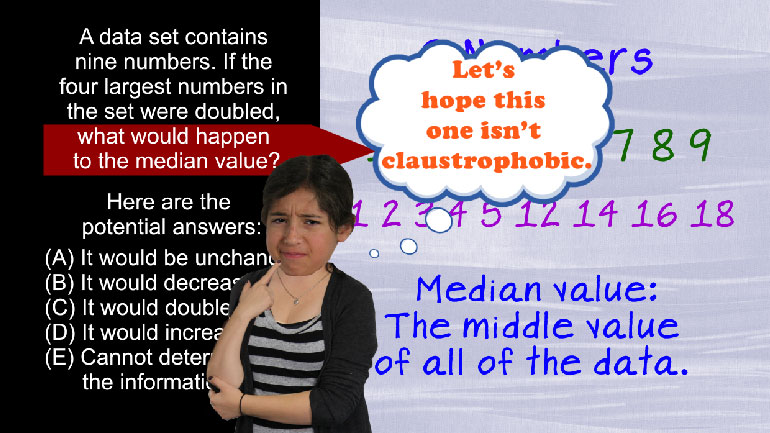
SAT Math: Statistics and Probability Drill 1, Problem 2. If the four largest numbers in the set were doubled, what would happen to the median...

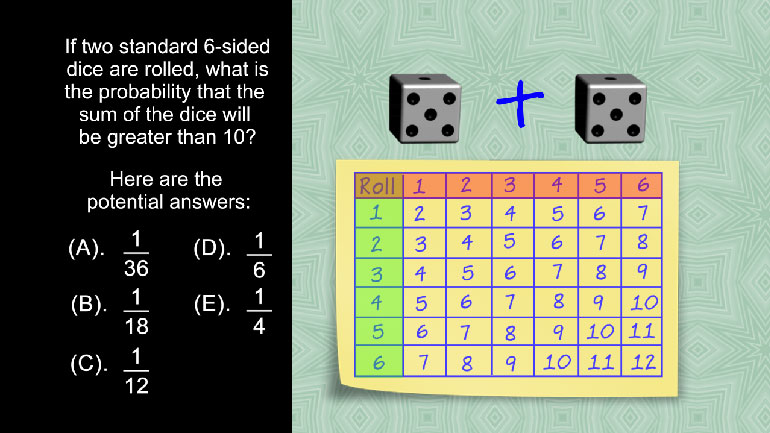
SAT Math 1.3 Statistics and Probability. Approximately what is the probability that they will be placed in alphabetical order?
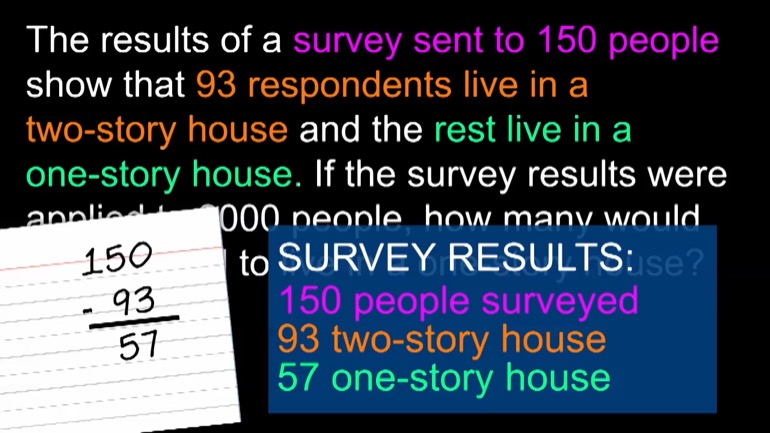
SAT Math: Applying Survey Results to a Larger Data Set Using Percentages 7 Views
Share It!
Description:
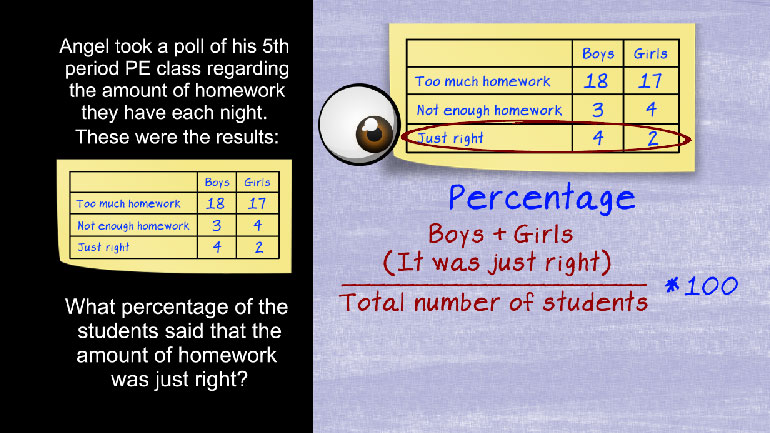
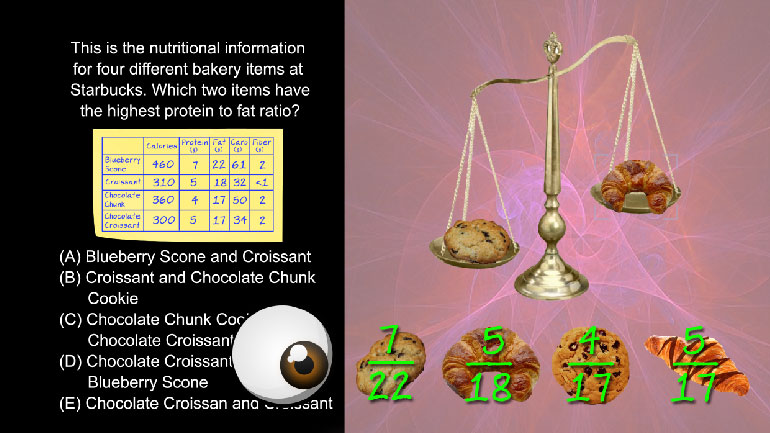
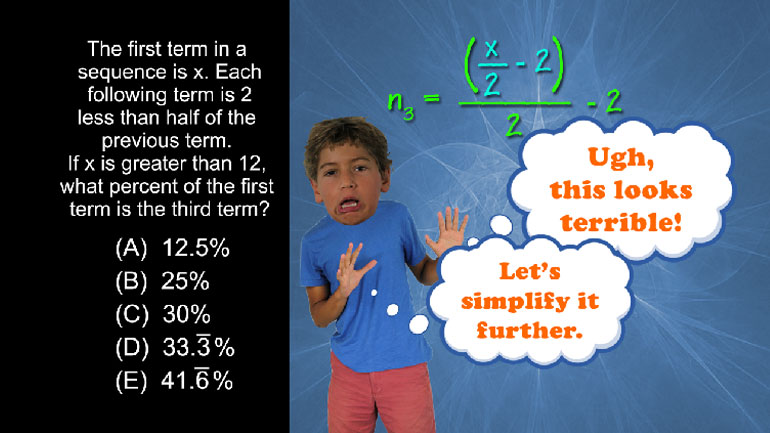
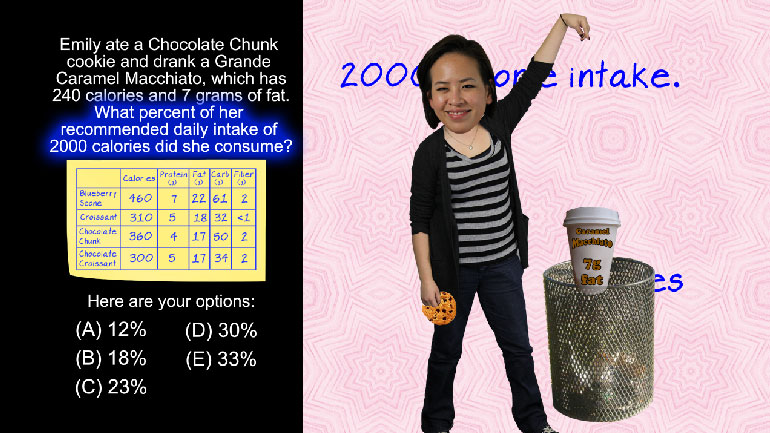
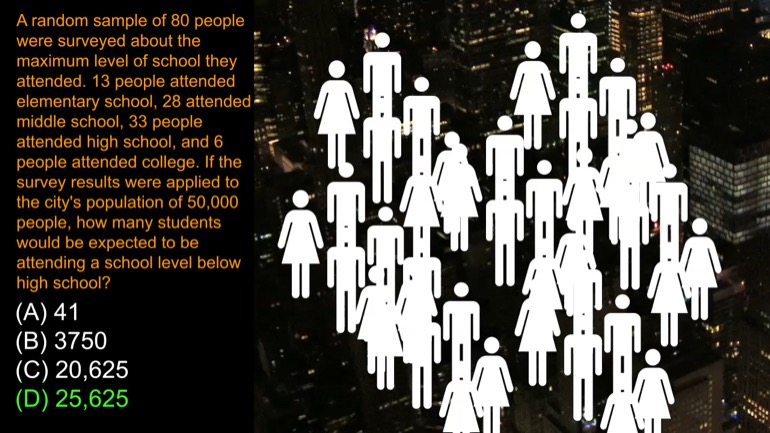
A random sample of 80 people were surveyed about the maximum level of school they attended. 13 people attended elementary school, 28 attended middle school, 33 people attended high school, and 6 people attended college. If the survey results were applied to the city's population of 50,000 people, how many students would be expected to be attending a school level below high school?
Related Videos
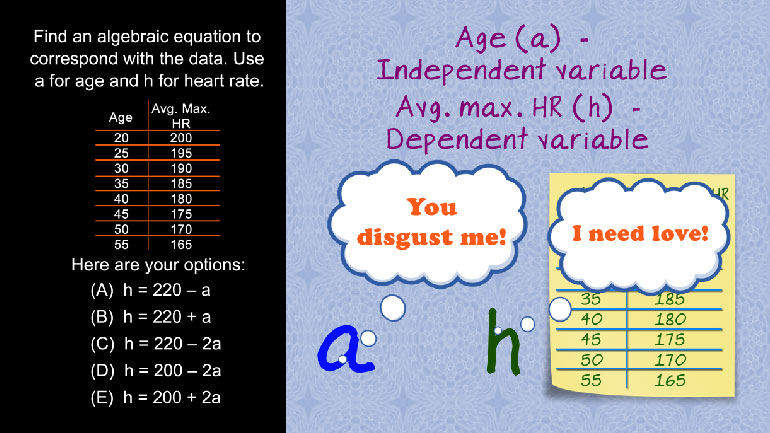
SAT Math 1.1 Algebra and Functions. Find an algebraic equation to correspond with the data.

SAT Math 1.1 Geometry and Measurement. What is the circumference of the circle?
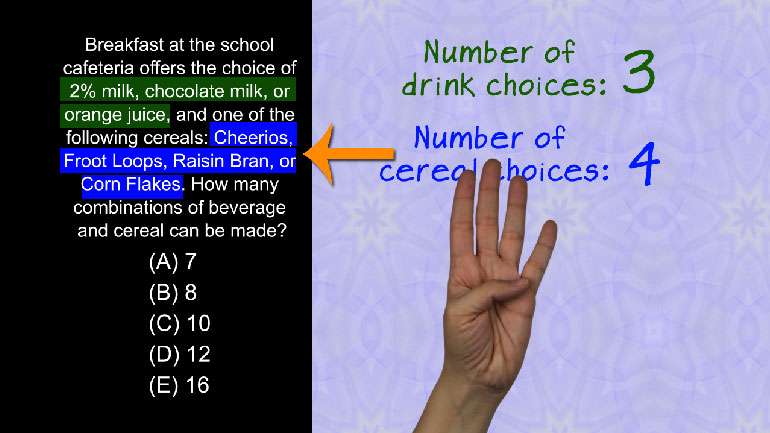
SAT Math 1.1 Numbers and Operations. How many combinations of beverage and cereal can be made?
SAT Math 1.1 Statistics and Probability. In which of the following data sets are the arithmetic mean and the median equal?
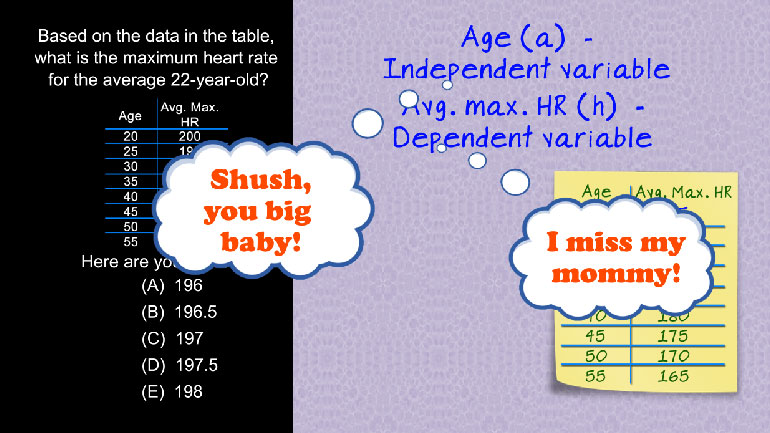
SAT Math: Algebra and Functions Drill 1, Problem 2. Based on the data in the table, what is the maximum heart rate for the average 22-year-old?