ShmoopTube
Where Monty Python meets your 10th grade teacher.
Search Thousands of Shmoop Videos
Test Prep Videos 986 videos


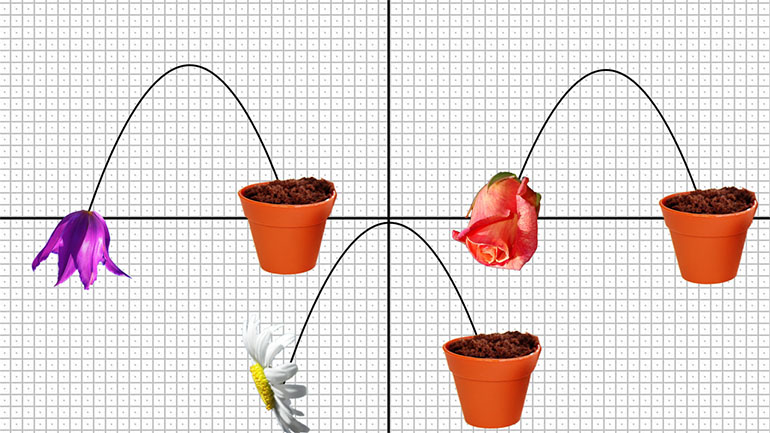


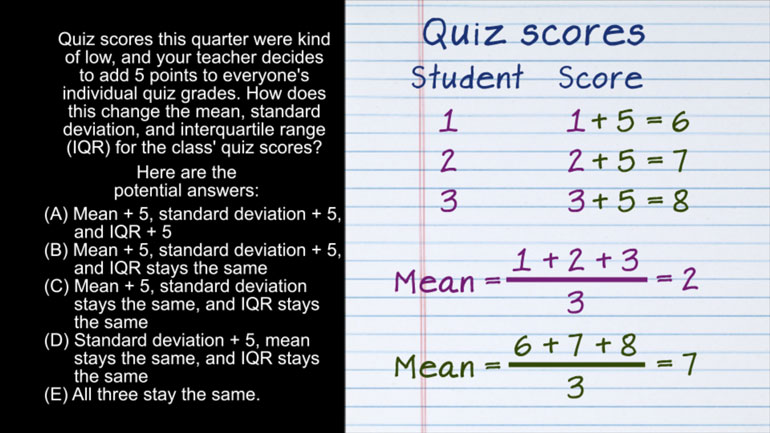
AP Statistics 2.1 Exploring Data. How does this change affect the mean, standard deviation, and IQR?
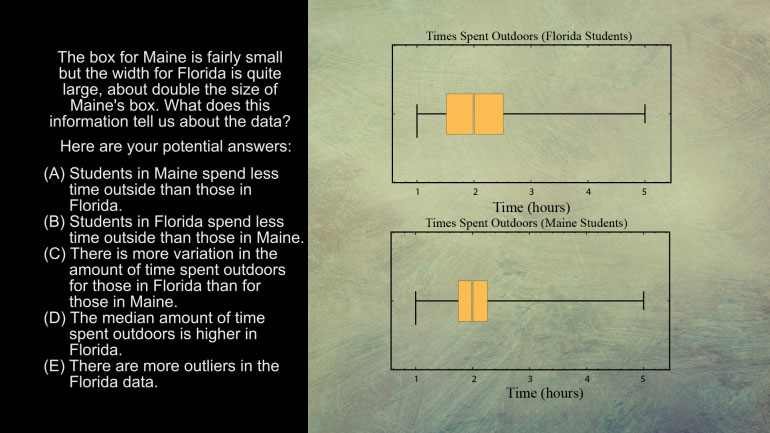
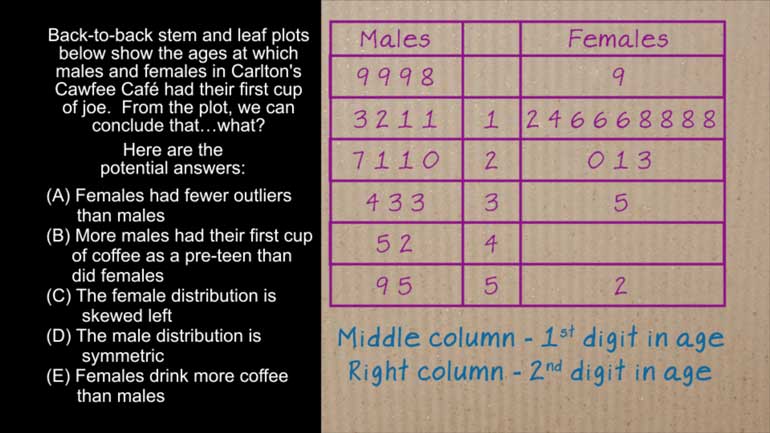
AP Statistics 5.1 Exploring Data. What does this information tell us about the data?
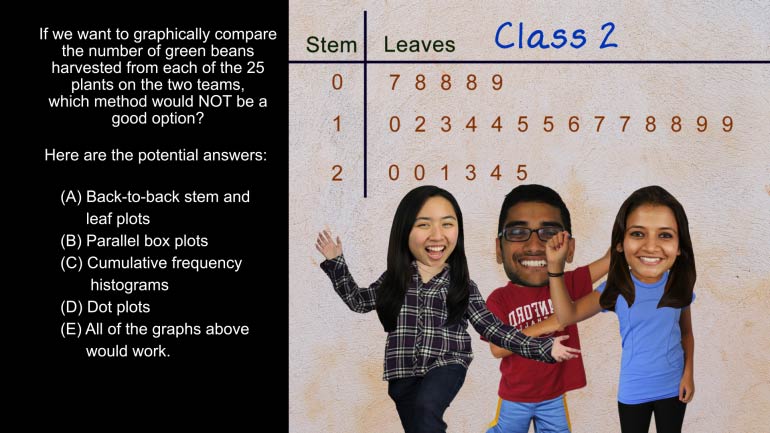
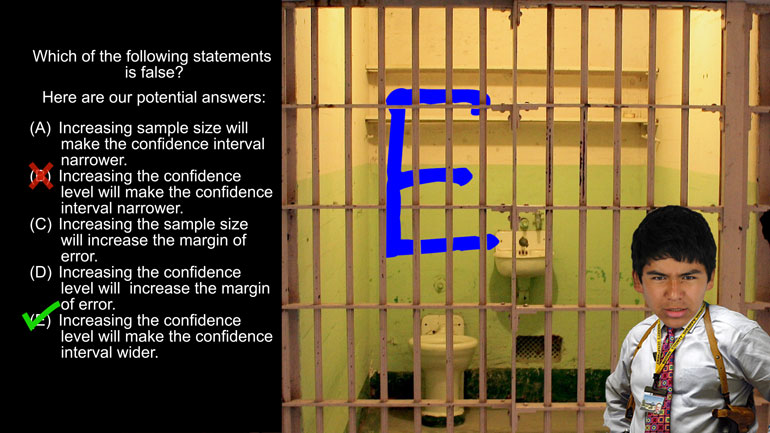
AP Statistics 5.2 Exploring Data. Which method would not be a good option?
SAT Math: Comparing Values on a "Best Fit" Line 25 Views
Share It!
Description:
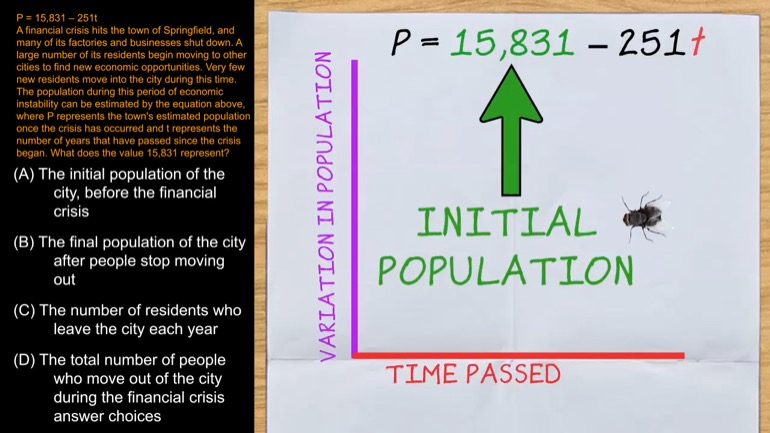
The scatterplot above shows the decline of the population of a species of endangered wolf. Using the line of best fit, find the difference between the predicted population and the actual population in 2001. Write your answer as a positive number and round to the nearest hundred.
The scatterplot above shows the decline of the population of a species of endangered wolf. Using the line of best fit, find the difference between the predicted population and the actual population in 2001. Write your answer as a positive number and round to the nearest hundred.
Related Videos
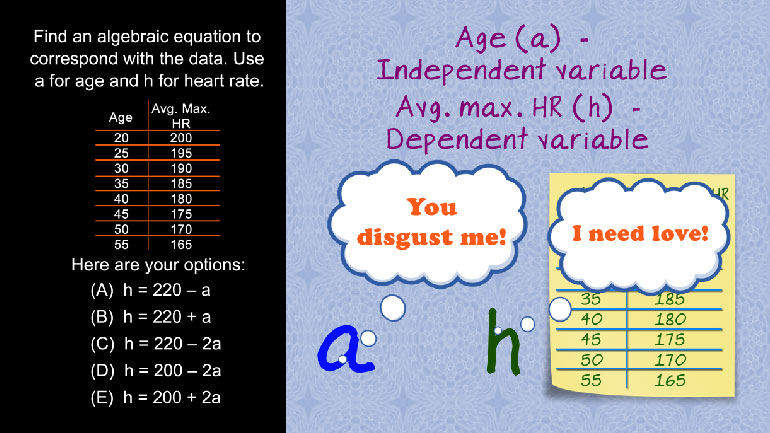
SAT Math 1.1 Algebra and Functions. Find an algebraic equation to correspond with the data.

SAT Math 1.1 Geometry and Measurement. What is the circumference of the circle?
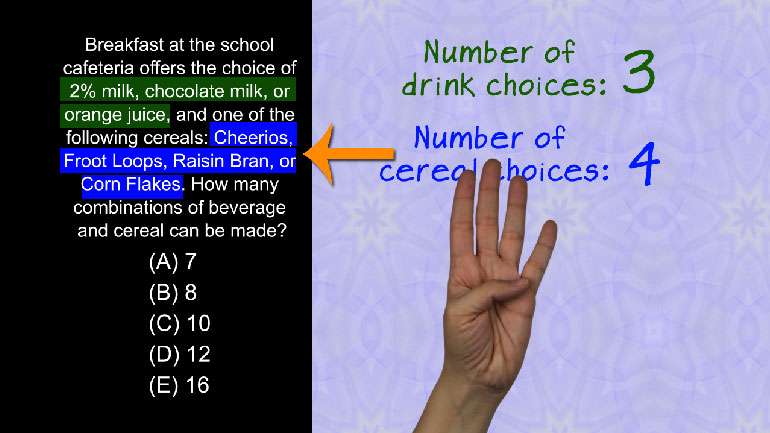
SAT Math 1.1 Numbers and Operations. How many combinations of beverage and cereal can be made?
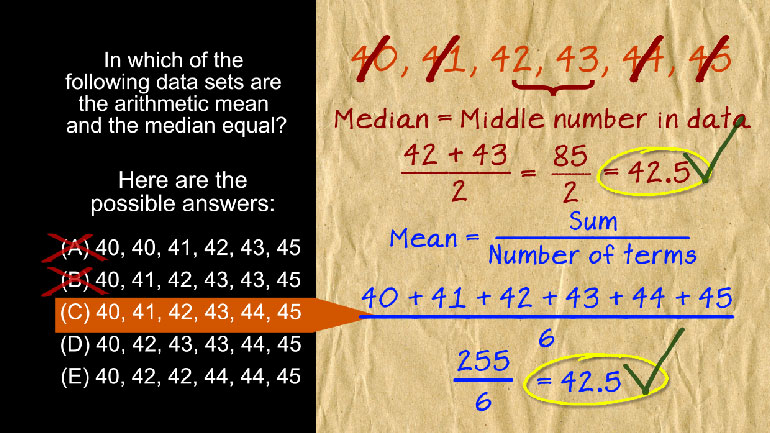
SAT Math 1.1 Statistics and Probability. In which of the following data sets are the arithmetic mean and the median equal?
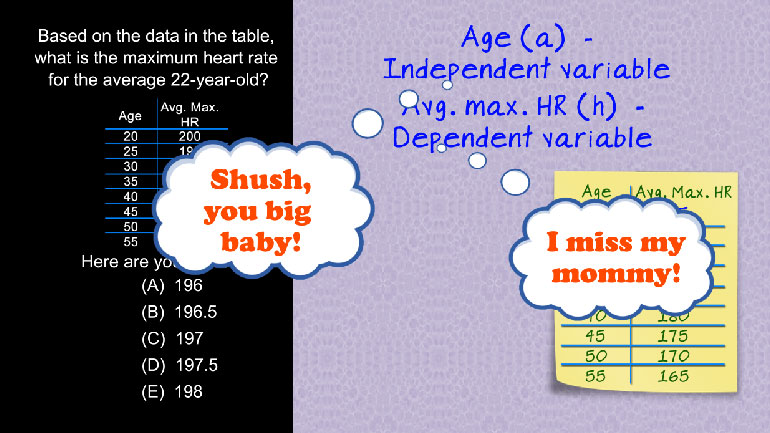
SAT Math: Algebra and Functions Drill 1, Problem 2. Based on the data in the table, what is the maximum heart rate for the average 22-year-old?