We’re kickin’ it up a notch now. We are entering the realm of linear inequalities with not one, but two variables. Oh snap. And you thought inequalities couldn’t get any more exciting.
Think of these graphs as either attending a limbo party or attempting an Olympic-level high jump. When you graph linear inequalities, you'll have to shade the graph either under or over the line.

A linear inequality looks like the linear equations we've been dealing with so far, except the "=" sign is swapped out with one of the four inequality symbols (<, ≤, >, ≥).
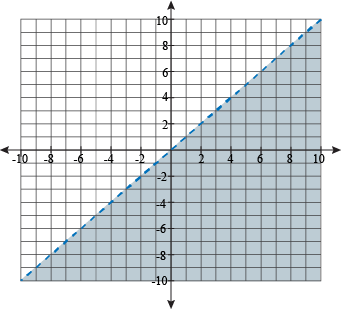
Here's y < x. The line itself looks the same as y = x, except someone took a pair of safety scissors to it and chopped it into pieces. Tammy, see us after class.
The shady part of the graph hangs with the wrong crowd, but it shows the right answer to the question, "When is y less than x?" That's why (1, -1) is shaded but (-1, 1) is not.
Sample Problem
Graph the equation 4x + 2y ≥ 1.
Seeing a graph isn't enough to understand this stuff; we need to get our hands dirty by making one.
We're starting this problem off by ignoring the inequality sign. Give it the "Grandpa wants to tell us the same story about finding a dollar" treatment. "But that was back in the '30s, when a dollar still meant something." Yes, Grandpa, we know.
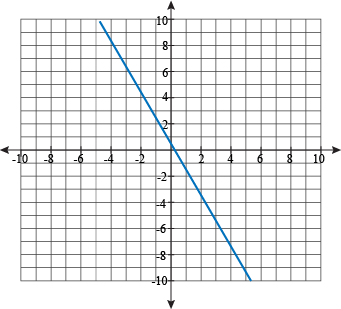
The first step is to treat the equation as though it had an equal sign. Put the equation into slope-intercept form.
2y ≥ -4x + 1

Now we graph it, continuing to ignore the inequality sign—except for one thing. We check to see if it's a strict inequality or not. Our inequality has the "equal" line under it, so it isn't strict. So, we graph it with a solid line. If it were a strict inequality sign instead (like < or >), we would've graphed it with a dotted line.
At this point, we can stop ignoring the inequality sign. We're still ignoring Grandpa, though. He's still going on about that dollar.
Half of our graph will satisfy the inequality, while the other half won't. To check which is which, we'll plug in a point from one side and see if the resulting expression is true; if it is, then that side of our graph will be shaded in. Otherwise, the other side of the line is the lucky winner.
We want a point that will be easy to test. The poster child for test points is (0, 0).


Is zero greater than or equal to one-half? No, it isn't. We don't even need to whip out a number line to check. That means we shade in the part of the graph that does not include (0, 0).
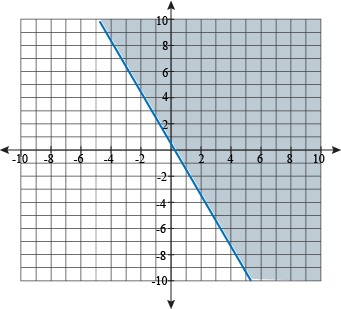
Everything to the right of the line will be a true solution to the inequality. (5, 1)? Yep. (3, -2)? Check-a-reno. (1, 60000000)? Absurd, but true.
Sample Problem
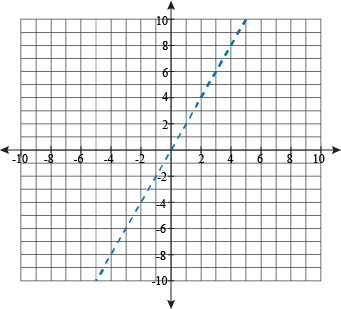
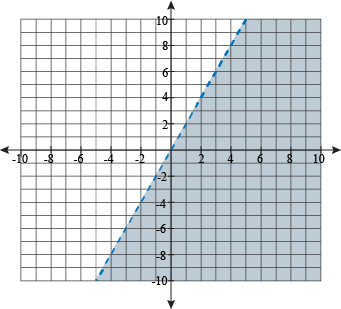
Graph the equation y < 2x.
The equation y = 2x might be easy to graph, but don't rush off quite yet. Unlike the last problem, we have a strict inequality now. We'd receive a sharp rap on the knuckles with a ruler if we tried graphing our equation like normal.
The solutions to this inequality do not include the line y = 2x itself. All the solutions have to be less than 2x, but they can't be equal. We much prefer equality, but we can't argue against the shark-mouthed math sign.
To show that the inequality is strict, we use a dotted line for the graph, like so:
Now to shade the graph. We'd love to use (0, 0) again, but that isn't going to work out: (0, 0) is on the line directly, so we can't test the inequality with it. What if it was true? We wouldn't know which side of the line to shade.
Bummer. How about (1, 0) instead? That's almost as good.
Is 0 < 2?
Yep, that works. Zero is definitely smaller than 2. That means we shade in the same side of the graph that (1, 0) is on, to the right.
Steps to Inequality Domination
Have a linear inequality and don't know what to do? Do this.
- Graph the boundary line of the inequality. To do this, just graph the line as you would if the inequality symbol was an equal sign. Don’t let the shark mouth freak you out.
- When the inequality has either a ≤ or ≥, the boundary line will be solid. When the inequality has either a < or >, the boundary line will be dotted.
- Test a point not on the boundary line by plugging in the x and y values into the inequality to see if it is a solution of the inequality.
- If the point is a solution, shade the half-plane that point is in. If it is not a solution, shade the other half-plane. If it is not not a solution, shade the half-plane that point is in.
- Choose a point that is easy to test, like (0, 0), (1, 0), or (1, 1). Why make things hard on us?