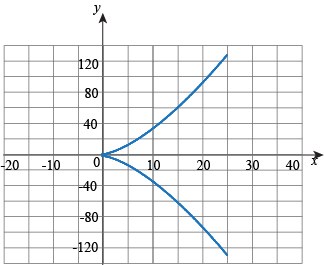
Now that we've managed to capture a few mythological beasts and have squashed them inside our laptop for processing, we want a picture of it. After all, all of that work is a tall tale until you convince your friends with the pictorial evidence. This will make it easier to remember how to capture them the next time.
Much like scalar functions, when we draw vector functions, we get a much better idea of what they do and how they work. Like scalar functions, we begin the same way by plotting a table of values, graphing those values, and connecting the dots. See, math is like a game of connect-the-dots.
When graphing vector functions, we should be sure to know what values of the input variable we want to consider. Then we calculate the output values given by the vector function at those points.


