ShmoopTube
Where Monty Python meets your 10th grade teacher.
Search Thousands of Shmoop Videos
Graphs of Univariate Data Distributions Videos
Play All

AP Statistics: Exploring Data Drill 1, Problem 2. Which of the following is the best way to display this type of data?
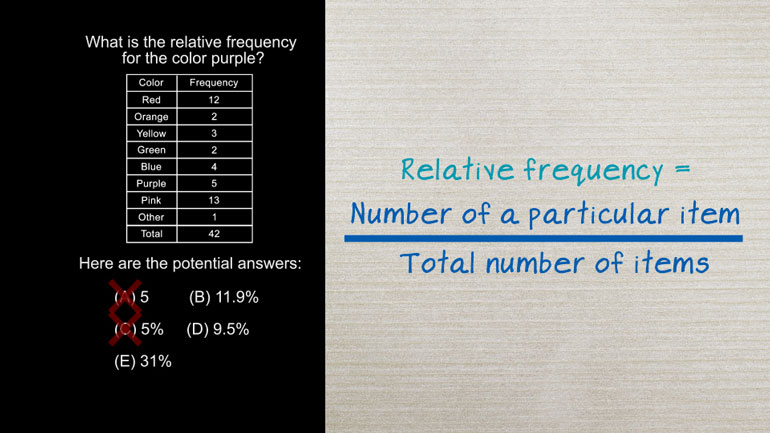
AP Statistics 5.5 Exploring Data. What is the relative frequency for the color purple?
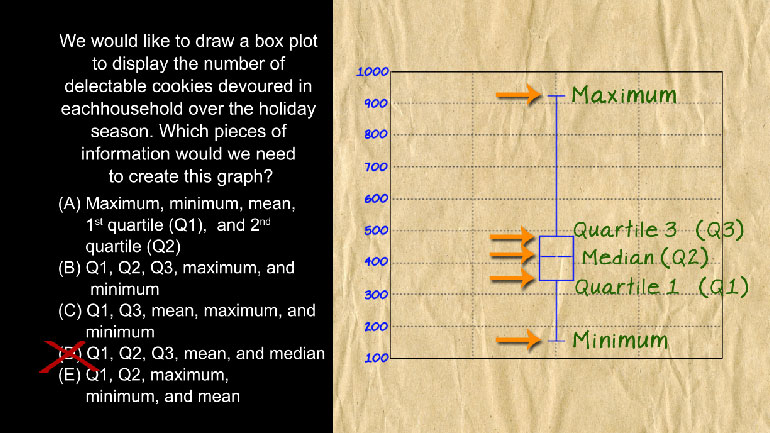
AP Statistics: Exploring Data Drill 1, Problem 5. Which pieces of information would we need to create this graph?
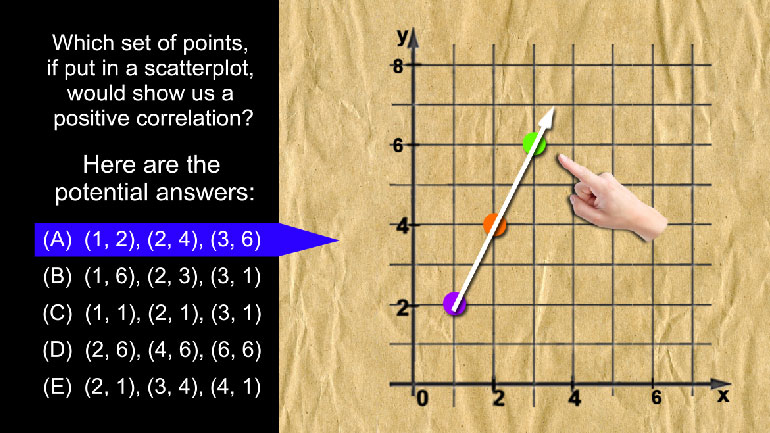
AP Statistics: Exploring Data Drill 2, Problem 3. Which set of points, if put in a scatterplot, would show us a positive correlation?
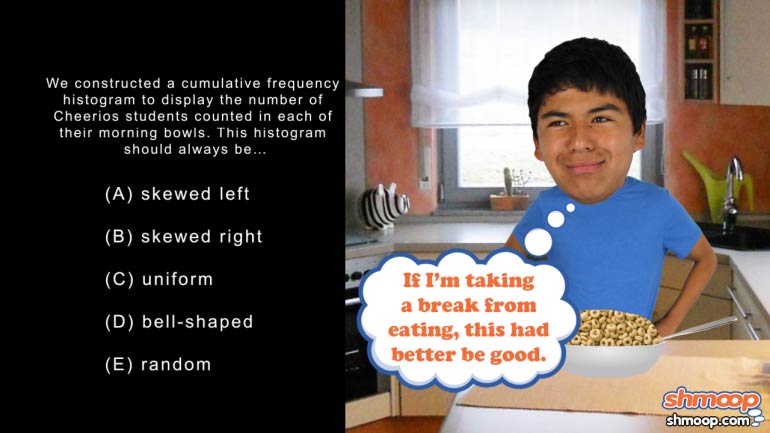
AP Statistics 1.1 Exploring Data. What should this histogram always be?