Think you’ve got your head wrapped around Basic Statistics & Probability? Put your knowledge to
the test. Good luck — the Stickman is counting on you!
Q. These are the average temperatures (°F) in Miami, Florida, for each month of the year.
| Jan | Feb | Mar | Apr | May | Jun | Jul | Aug | Sept | Oct | Nov | Dec |
| 67.2 | 68.5 | 71.7 | 75.2 | 78.7 | 81.4 | 82.6 | 82.8 | 81.9 | 78.3 | 73.6 | 69.1 |
Compare the mean and median of the data.
The mean is higher.
The median is higher.
They are equal.
There is no median.
There is no mean.
Q. These are the average temperatures (°F) in Miami, Florida, for each month of the year.
| Jan | Feb | Mar | Apr | May | Jun | Jul | Aug | Sept | Oct | Nov | Dec |
| 67.2 | 68.5 | 71.7 | 75.2 | 78.7 | 81.4 | 82.6 | 82.8 | 81.9 | 78.3 | 73.6 | 69.1 |
Find the interquartile range of this data.
4.775
5.7
8.334
10.475
15.6
Q. These are the average temperatures (°F) in Miami, Florida, for each month of the year.
| Jan | Feb | Mar | Apr | May | Jun | Jul | Aug | Sept | Oct | Nov | Dec |
| 67.2 | 68.5 | 71.7 | 75.2 | 78.7 | 81.4 | 82.6 | 82.8 | 81.9 | 78.3 | 73.6 | 69.1 |
If the average temperature in August were changed to 85°F, how would the mean and median change?
The mean would rise, and the median would stay the same.
The mean would stay the same, and the median would rise.
The mean and median would rise.
The mean and median would stay the same.
Neither the mean nor the median would change.
Q. 
What type of correlation is depicted with this graph?
Positive
Negative
Alternating between positive and negative
None
I <3 American Idol.
Q.
What age, in years, has produced the most finalists?
23
24
25
26
27
Q. What is the mean age, in years, of the finalists?
Hint: This problem is trickier than it seems. There are four 16 year-olds, eight 17 year-olds, two 18 year-olds, and so on.
6.43
22.48
22.50
23.00
24.87
Q. This stem-and-leaf plot shows the grade point averages of 25 random middle school students (3|0 represents a GPA of 3.0).

Find the median of the data set.
3.0
3.1
3.2
3.3
3.4
Q. This stem-and-leaf plot shows the grade point averages of 20 random middle school students (3|0 represents a GPA of 3.0).
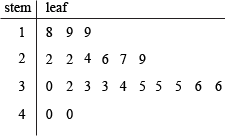
What percentage of the students has a GPA above 2.0?
8%
12%
36%
54%
88%
Q. This stem-and-leaf plot shows the grade point averages of 20 random middle school students (3|0 represents a GPA of 3.0).
What is the mode of this data?
0.8
1.9
2.2
3.3
3.5
Q. Fifteen students took a science test worth 30 points. These are their scores: 20, 22, 22, 22, 23, 23, 23, 23, 24, 24, 24, 25, 25, 29, and 30.
Which score(s) is an outlier?
29
30
29 and 30
None
22