ShmoopTube
Where Monty Python meets your 10th grade teacher.
Search Thousands of Shmoop Videos
ACT Science 2.6 Data Representation Passage 292 Views
Share It!
Description:
ACT Science: Data Representation Passage Drill 2, Problem 6. How is the data presented in Figure 2 similar to the data presented in Figure 1?
Transcript
- 00:04
Here's your shmoop du jour, brought to you by older animals.
- 00:07
Good luck trying to fit a to set of dentures into the mouth of a mature rhinoceros.
- 00:16
How is the data presented in Figure 2 the data presented in Figure 1?
- 00:23
Here are the potential answers...
- 00:27
The key to this question is figuring out what
Full Transcript
- 00:29
the two figures represent. Figure 2 looks at four specific proteins in
- 00:33
fem-1(-) and gon-2(-) worms, and it shows the absolute level of protein aggregation
- 00:38
in young and old worms. Like Figure 1, the general take-home message
- 00:42
is the same: there is an increase in protein aggregation in older worms.
- 00:51
We got this message by looking at the increase in fold change.
- 00:55
Well, the correct answer is (C).
Up Next
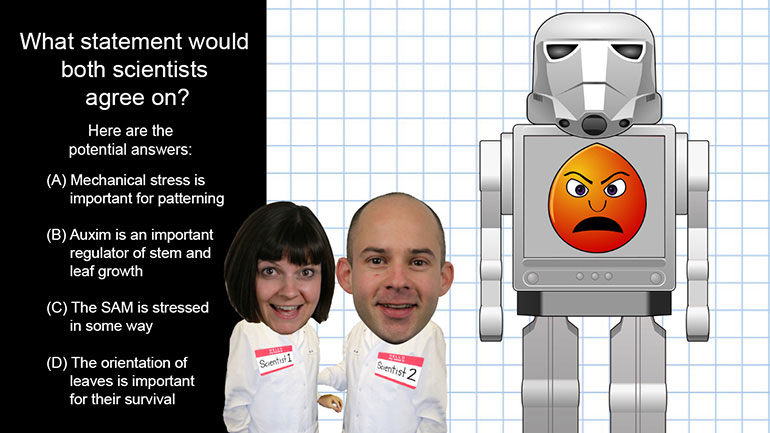
ACT Science: Conflicting Viewpoint Passage Drill 1, Problem 1. What statement would both scientists agree upon?
Related Videos
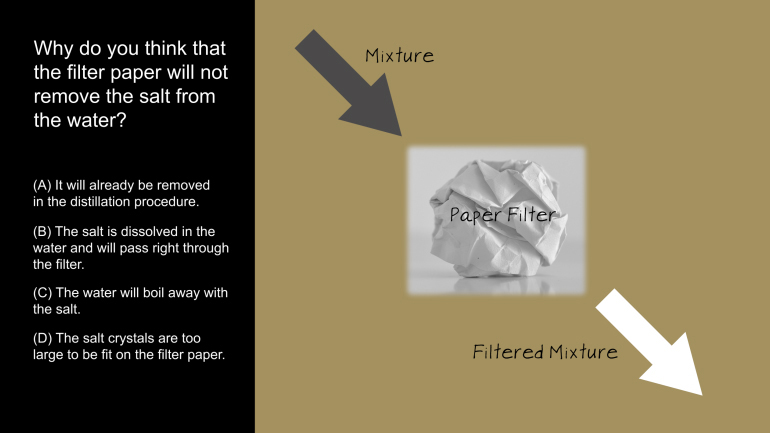
ACT Science: Research Summary Passage Drill 2, Problem 1. Why do you think that the filter paper will not remove the salt from the water?
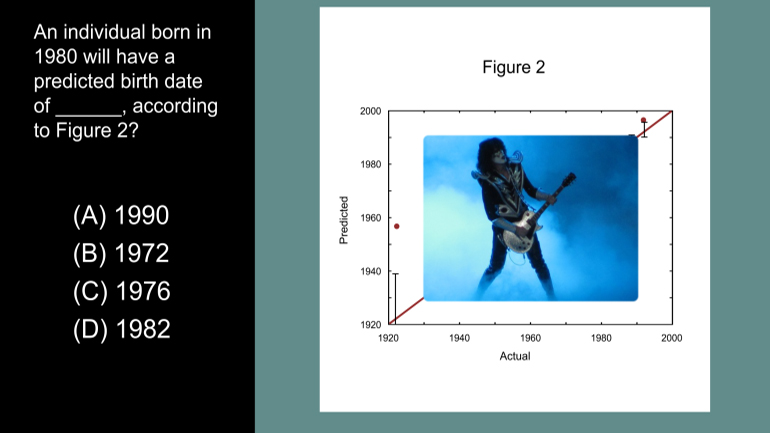
ACT Science Data Representation Passage: Drill 3, Problem 5. According to Figure 2, what birth date will be predicted for an individual actual...

ACT Science: Data Representation Passage Drill 1, Problem 2. Which of the following is a variable in Figure 1, but not in Figure 2?

ACT Science: Data Representation Passage Drill 1, Problem 1. What do the statistics in Figure 1 suggest?