Answer
- If we use two sub-intervals, the length of a sub-interval is
 .
.
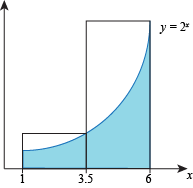
The subintervals are then [1, 3.5] and [3.5, 6].
On the first sub-interval the height of the rectangle is
f(3.5) = 23.5
and the width of the rectangle is 2.5 (the length of the sub-interval), so the area of the first rectangle is
23.5(2.5) ≈ 28.28
On the second sub-interval the height of the rectangle is
f(6) = 26 = 64
and the width is 2.5, so the area of this second rectangle is
64(2.5) = 160.
Adding the areas of the rectangles together, we estimate that the area of S is approximately
28.28 + 160 = 188.28.
- Dividing the interval [1, 6] into 5 sub-intervals gives us sub-intervals of length 1, so each rectangle will have width 1.
Sub-interval [1, 2]:
The height of the rectangle is
f(2) = 22 = 4
so the area of the rectangle is
height ⋅ width = 4(1) = 4.
Sub-interval [2, 3]:
The height of the rectangle is
f(3) = 23 = 8
so the area of the rectangle is
height ⋅ width = 8(1) = 8.
Sub-interval [3, 4]:
The height of the rectangle is
f(4) = 24 = 16
so the area of the rectangle is
height ⋅ width = 16(1) = 16.
Sub-interval [4, 5]:
The height of the rectangle is
f (5) = 25 = 32
so the area of the rectangle is
height ⋅ width = 32(1) = 32.
Sub-interval [5, 6]: The height of the rectangle is
f(6) = 26 = 64
so the area of the rectangle is
height ⋅ width = 64(1) = 64.
Adding the areas of all these rectangles together, we estimate that the area of S is
4 + 8 + 16 + 32 + 64 = 124.
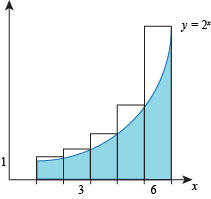
The approximations found in are both overestimates, as we can see the rectangles cover all of S and then some.


 and the x-axis on the interval [1, 4].


 .
.
 .
.


 .
.


