ShmoopTube
Where Monty Python meets your 10th grade teacher.
Search Thousands of Shmoop Videos
English II EOC Assessment Videos 217 videos


Want to pull an Oliver Twist and ask us for more? We've gotcha covered. Head over to /video/subjects/test-prep/texas-eoc-ii/texas-eoc-english-ii/ f...
Want to pull an Oliver Twist and ask us for more? We've gotcha covered. Click on the link for more Texas EOC goodness. Porridge not included.
ACT Science 2.6 Data Representation Passage 236 Views
Share It!
Description:
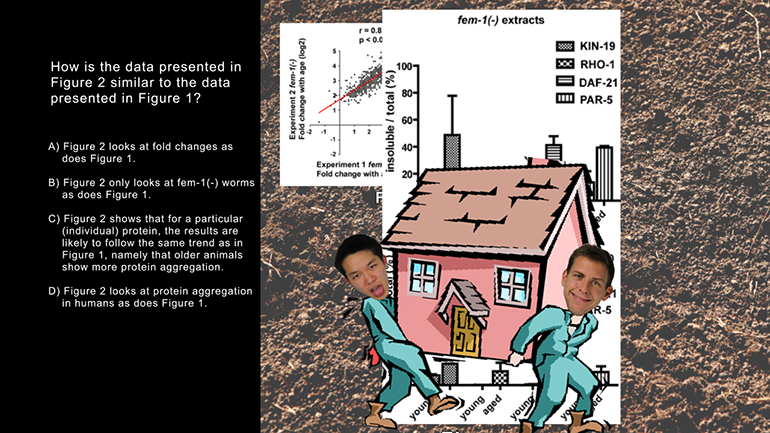
ACT Science: Data Representation Passage Drill 2, Problem 6. How is the data presented in Figure 2 similar to the data presented in Figure 1?
Transcript
- 00:04
Here's your shmoop du jour, brought to you by older animals.
- 00:07
Good luck trying to fit a to set of dentures into the mouth of a mature rhinoceros.
- 00:16
How is the data presented in Figure 2 the data presented in Figure 1?
- 00:23
Here are the potential answers...
- 00:27
The key to this question is figuring out what
Full Transcript
- 00:29
the two figures represent. Figure 2 looks at four specific proteins in
- 00:33
fem-1(-) and gon-2(-) worms, and it shows the absolute level of protein aggregation
- 00:38
in young and old worms. Like Figure 1, the general take-home message
- 00:42
is the same: there is an increase in protein aggregation in older worms.
- 00:51
We got this message by looking at the increase in fold change.
- 00:55
Well, the correct answer is (C).
Related Videos
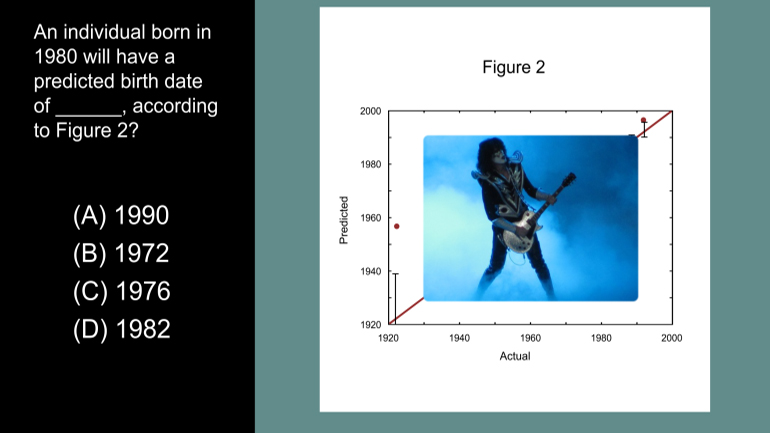
ACT Science Data Representation Passage: Drill 3, Problem 5. According to Figure 2, what birth date will be predicted for an individual actual...

ACT Science: Data Representation Passage Drill 1, Problem 2. Which of the following is a variable in Figure 1, but not in Figure 2?

ACT Science: Data Representation Passage Drill 1, Problem 1. What do the statistics in Figure 1 suggest?
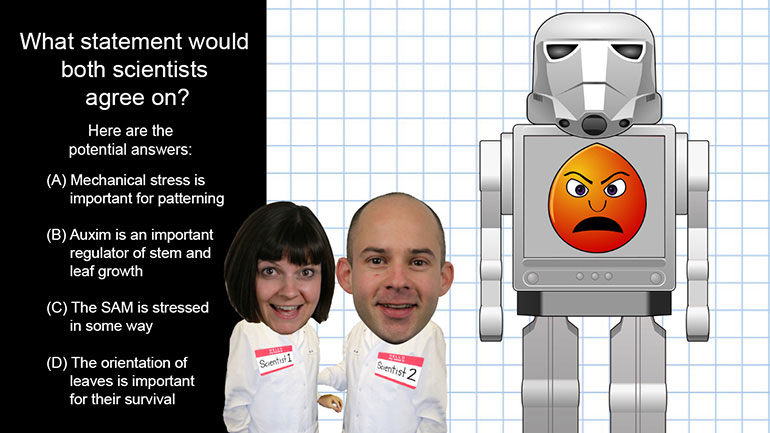
ACT Science: Conflicting Viewpoint Passage Drill 1, Problem 1. What statement would both scientists agree upon?
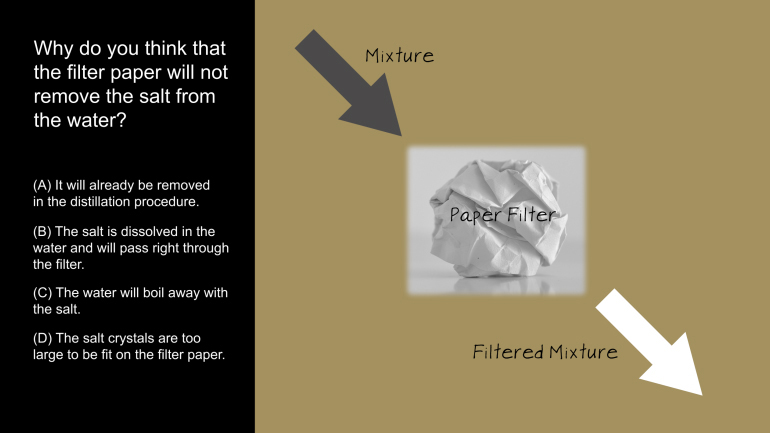
ACT Science: Research Summary Passage Drill 2, Problem 1. Why do you think that the filter paper will not remove the salt from the water?