ShmoopTube
Where Monty Python meets your 10th grade teacher.
Search Thousands of Shmoop Videos
Exploring Data Videos 25 videos


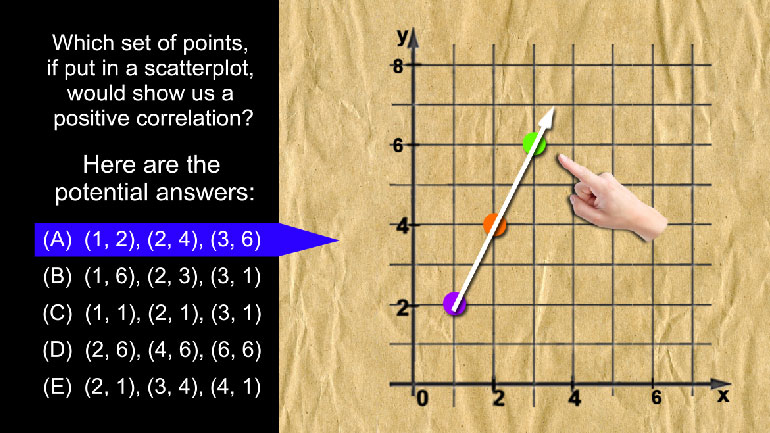
AP Statistics: Exploring Data Drill 2, Problem 3. Which set of points, if put in a scatterplot, would show us a positive correlation?

AP Statistics: Exploring Data Drill 1, Problem 2. Which of the following is the best way to display this type of data?
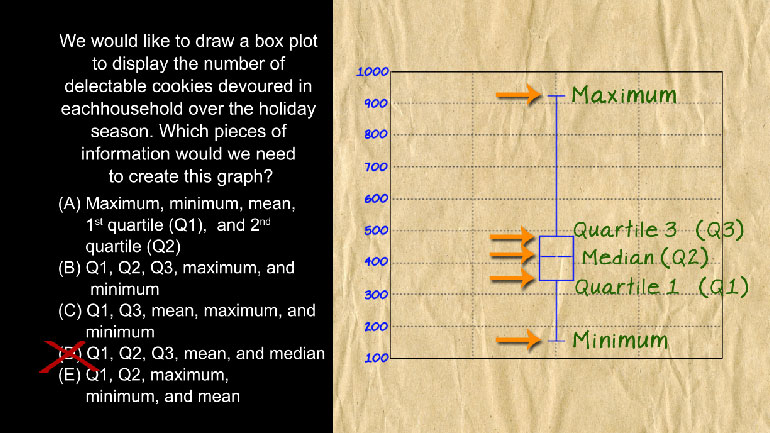
AP Statistics: Exploring Data Drill 1, Problem 5. Which pieces of information would we need to create this graph?
AP Statistics 3.1 Exploring Data 204 Views
Share It!
Description:
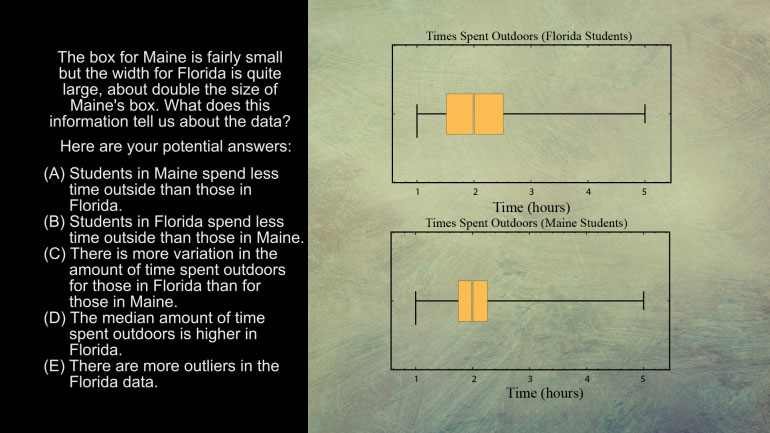
AP Statistics: Exploring Data Drill 3, Problem 1. What does this information tell us?
Transcript
- 00:02
Put this in your calculator and shmoop it.
- 00:05
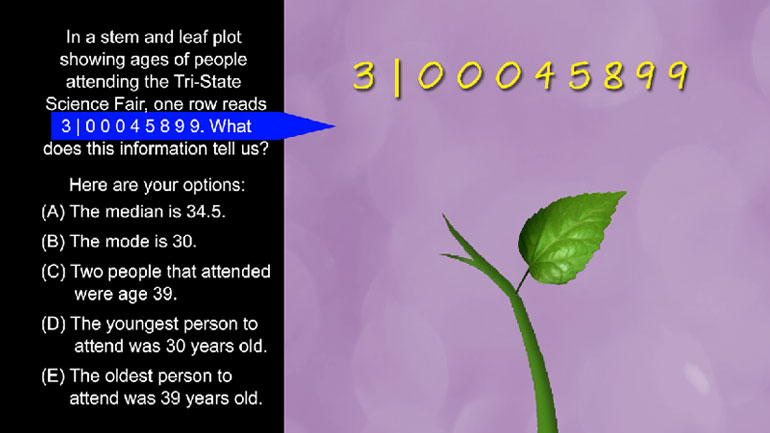
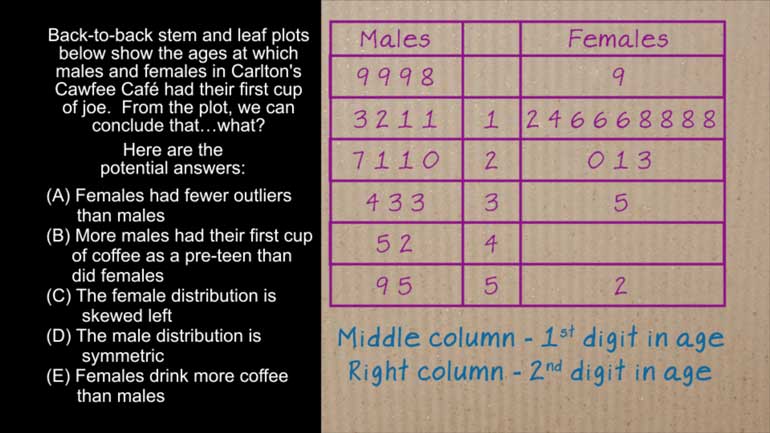
In a stem and leaf plot showing ages of people attending the Tri-State Science Fair,
- 00:10
one row reads "3, 0 0 0 4 5 8 9 9."
- 00:18
This information tells us that... what?
- 00:21
And here are the potential answers...
Full Transcript
- 00:26
We're given a single row from a stem and leaf plot, and we need to interpret it to figure
- 00:31
out which of our answer choices is true.
- 00:34
Remember that in a stem and leaf plot, the
- 00:35
stem is typically the tens value, and the leaves are the individual ones place values.
- 00:40
From this row, we know that the values in our stem and leaf plot are:
- 00:45
30, 30, 30, 34, 35, 38, 39, and 39. Now we can answer the question.
- 00:52
Answer choice A says that the median is 34.5. To find the median, we just find the middle
- 00:58
value of all of the data. But wait a second... we only know one row of values, and we don't
- 01:03
know the others. There could be any number of values in the
- 01:06
10's place, or 40's place...or anywhere. We simply don't know.
- 01:10
So we can eliminate answer choice A. Answer choice B wants us to find the mode,
- 01:14
or the most frequently occurring value in the data set.
- 01:18
But again, we don't know the other values in this data set...so it can't be B either.
- 01:22
If we take a quick scan of choices C, D, and E...
- 01:25
we realize we can't find the min and max in choices D and E either...
- 01:29
...again, because we don't know all the values of the data set.
- 01:32
The only answer choice left is (C).
- 01:34
C says that there were two 39 year olds at the science fair.
- 01:40
It just so happens that we have the row with people in their 30's, and it also just so
- 01:44
happens that there were exactly 2 people who were age 39.
- 01:49
Our answer is (C).
Related Videos
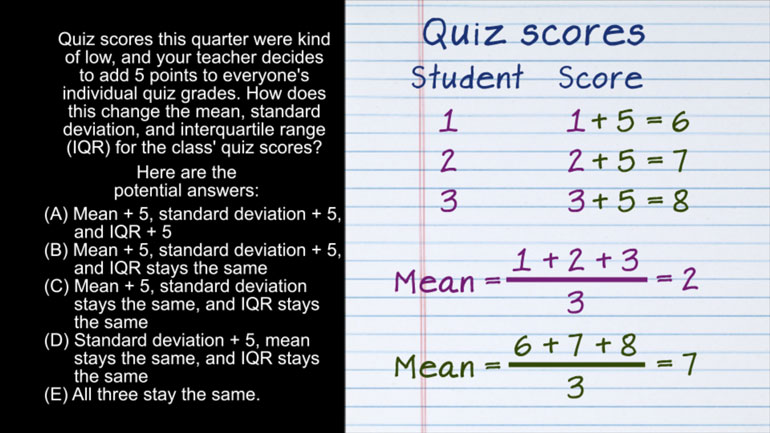
AP Statistics 2.1 Exploring Data. How does this change affect the mean, standard deviation, and IQR?
AP Statistics 5.1 Exploring Data. What does this information tell us about the data?
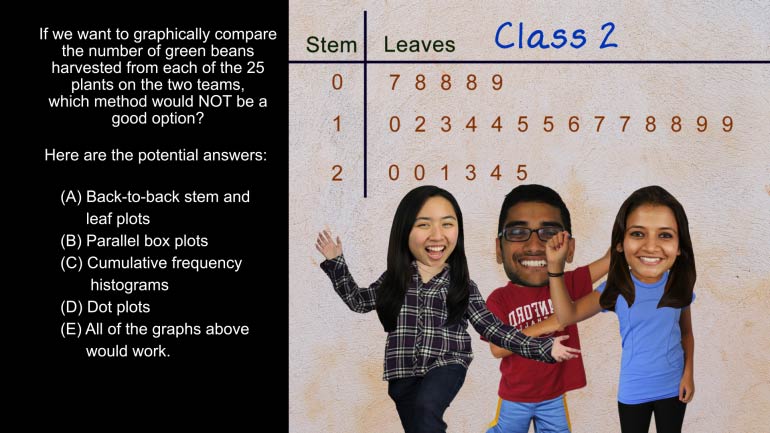
AP Statistics 5.2 Exploring Data. Which method would not be a good option?
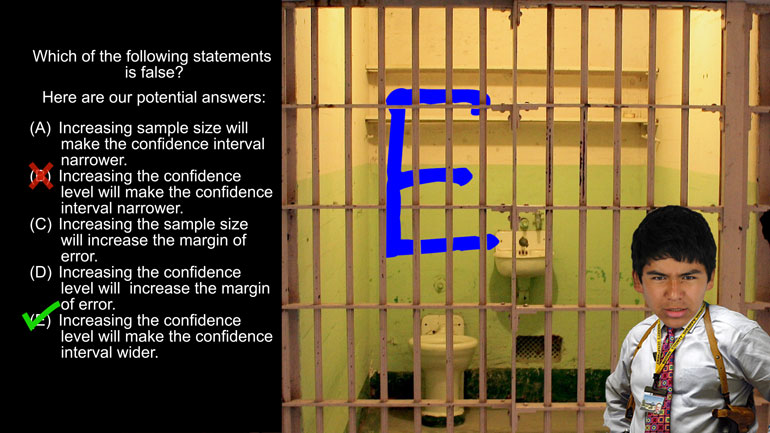
AP Statistics 1.5 Statistical Inference. Which of the following statements is false?

Want to pull an Oliver Twist and ask us for more? We've gotcha covered. Head over to /video/subjects/math/test-prep/ap-statistics/ for more AP...