ShmoopTube
Where Monty Python meets your 10th grade teacher.
Search Thousands of Shmoop Videos
AP U.S. History Videos 277 videos


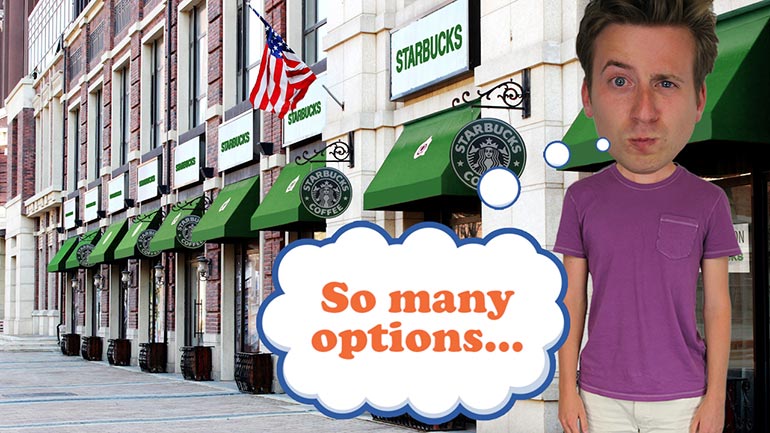


AP U.S. History Diagnostic 1. Relationships like the one shown in the image resulted in the development of...what?

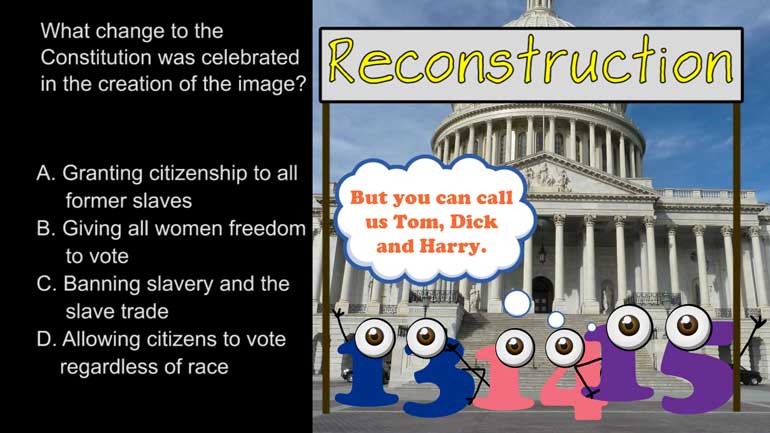
AP U.S. History Diagnostic 15. How did groups like the ones represented by the image influence industry in America?

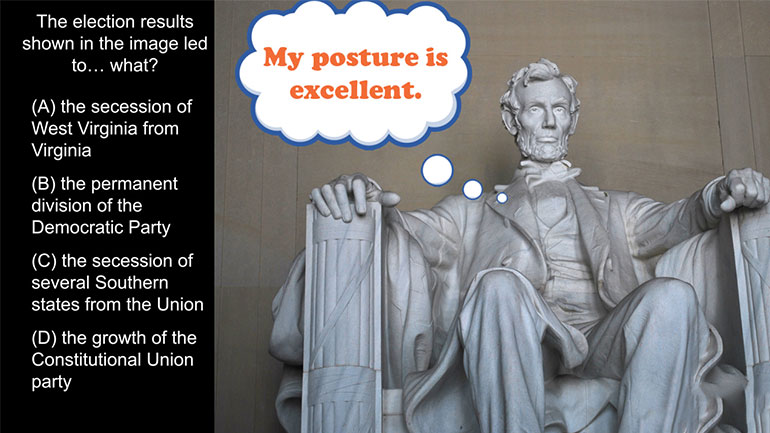
AP U.S. History Diagnostic 10. What led to the splintering of the political parties shown in the image?
AP U.S. History Exam 1.53 168 Views
Share It!
Description:
AP U.S. History Exam 1.53. What had the biggest impact on the population figures represented in the map?
Transcript
- 00:00
[ musical flourish ]
- 00:03
And here's your Shmoop du jour, brought to you by the census,
- 00:06
a long list of every mistake you've ever made.
- 00:09
Yeah, like that. There.
- 00:12
Okay, and the map.
Full Transcript
- 00:13
What had the biggest impact on the population figures
- 00:16
represented in the map right here?
- 00:18
And here are your potential answers.
- 00:19
[ mumbles ]
- 00:23
Okay, well what exactly are we looking for here?
- 00:26
According to the key, - no, this kind of key right here -
- 00:29
the darker colors on the map correspond to a higher percentage of
- 00:32
foreign-born population. So let's see what made these
- 00:34
particular places hot to trot for globetrotters.
- 00:37
Could the population figures represented in the map have
- 00:40
been impacted by the A - loosening of immigration restrictions?
- 00:44
Hmm. Well, there wasn't any substantial
- 00:46
change to immigration policy during the 1990s,
- 00:50
so there must have been a different reason for these worldly arrivals.
- 00:52
Were these population figures a result of B -
- 00:55
unemployment in the Midwest and Great Plains?
- 00:58
Well, unemployment in those regions could have forced people
- 01:00
to flee to the coast, but there wasn't a rising
- 01:03
tide of interstate migration among immigrants at this time.
- 01:05
So that puts B and C out to sea. [ chuckles ]
- 01:09
Which means these population figures were primarily caused
- 01:11
by D - a rise in immigration from Latin America and Asia.
- 01:16
See how those blue boxes are concentrated along California
- 01:19
and the Southwest border? Well, that suggests immigrants
- 01:22
born in Asia and Latin America chose areas of the U.S.
- 01:26
closest to their home countries. So D is the right answer.
- 01:28
For much of the foreign-born population, the West coast
- 01:31
was all clear for starting a new life in the United States.
- 01:36
[ splash ]
Related Videos

Ever heard of a "living document"? They eat and breathe just like the rest of us! They even walk around on their own two legs. Okay, fine—maybe t...

If the Puritans had gotten their way, religion would play a much larger role in lawmaking these days. Want to know more? Watch the video for all th...

What happened between the creation of the Articles of Confederation and the ratification of the current U.S. Constitution? This video analyzes the...
The Modernists thought the world had a lot of problems, and they were intent on fixing them—or at least talking about fixing them. Unfortunately,...

This video explains Federalism and the quest for a fair balance between state and national power. It covers the progression and compromises of Fede...