ShmoopTube
Where Monty Python meets your 10th grade teacher.
Search Thousands of Shmoop Videos
Scatterplots Videos 9 videos


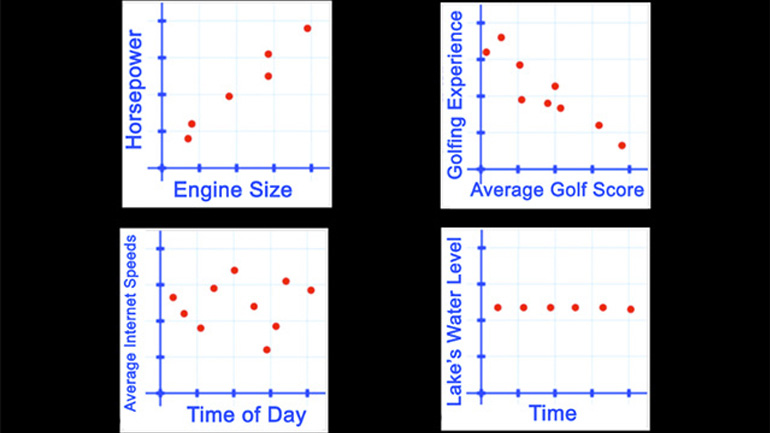
Statistics, Data, and Probability II Drill 4 Problem 1. Which of the following scatter plots represents a negative correlation between the data sets?
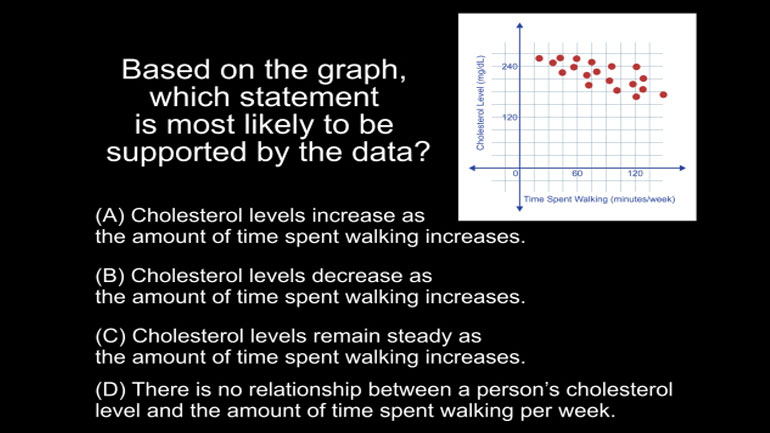
Statistics, Data, and Probability II Drill 4 Problem 2. Based on the graph, which statement is most likely to be supported by the data?
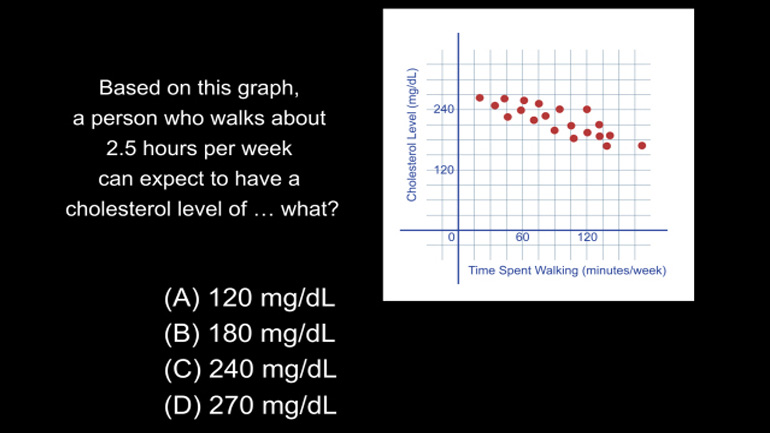
Statistics, Data, and Probability II Drill 4 Problem 3. Based on this graph, a person who walks about 2.5 hours per week can expect to have a...
CAHSEE Math 4.5 Statistics, Data, and Probability II 176 Views
Share It!
Description:
Statistics, Data, and Probability II Drill 4 Problem 5. Based on the graph, which of the following statements is true?
Transcript
- 00:03
Shmoopy question at 10 o’clock…
- 00:05
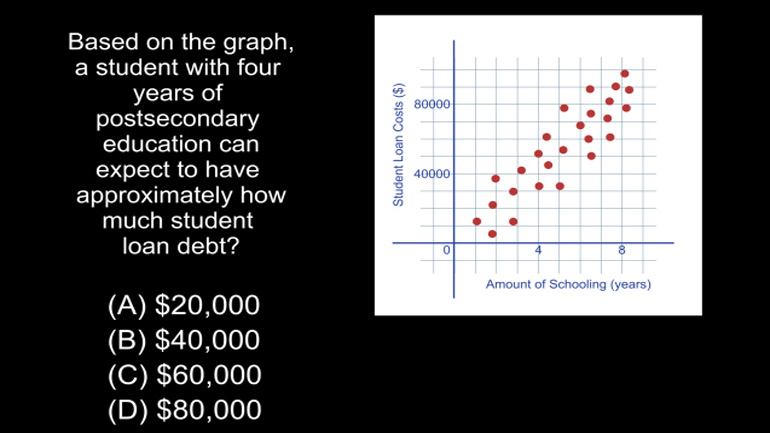
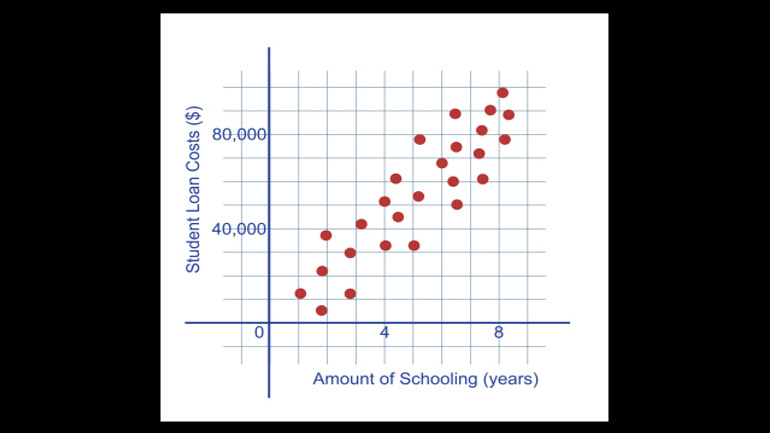
The following plot shows the relationship between the amount of postsecondary education
- 00:09
and the amount of student loan debt for several students.
- 00:12
Kinda makes you want to take over the family restaurant instead, doesn’t it?
- 00:16
Based on the graph, which of the following statements is true?
Full Transcript
- 00:19
And here are the potential answers...
- 00:27
Can we read a scatter plot? It may SOUND gross… but these puppies are really useful.
- 00:32
There’s no magic bullet to help us answer this one – we just have to go through the
- 00:35
potential answers one by one. And Boom. We don’t have to go far.
- 00:39
Option A says that there is a positive correlation between amount of education and debt –
- 00:46
and yeah – they both go up as they increase.
- 00:49
They are said to be POSITIVELY correlated.
- 00:52
All the other choices go the wrong way – that is, when the x axis increases, the y decreases
- 00:57
and vice versa.
- 00:58
So… let’s not waste time needlessly. That’s a job for the House of Representatives.
- 01:03
A is our answer.
Related Videos

CAHSEE Math: Algebra and Functions Drill 5, Problem 3. Solve the equation.
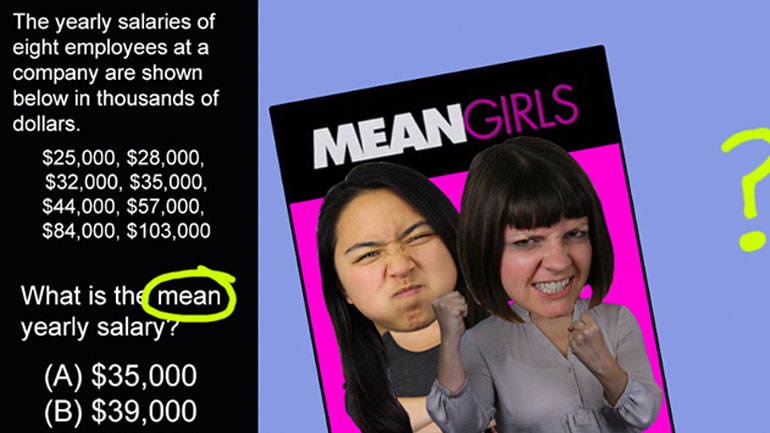
Statistics, Data, and Probability I: Drill Set 1, Problem 1. What is the mean yearly salary?

Statistics, Data, and Probability I: Drill Set 1, Problem 2. What is the median length of these writing utensils?
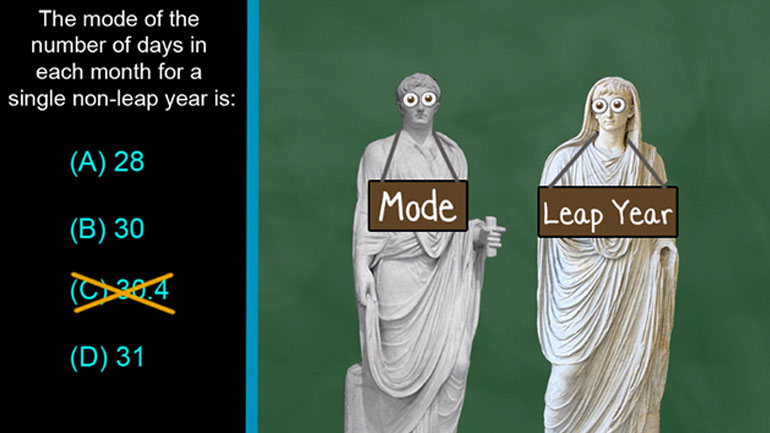
CAHSEE Math Statistics, Data, and Probability I: Drill Set 1, Problem 3. The mode of the number of days in each month for a single non-leap year is...
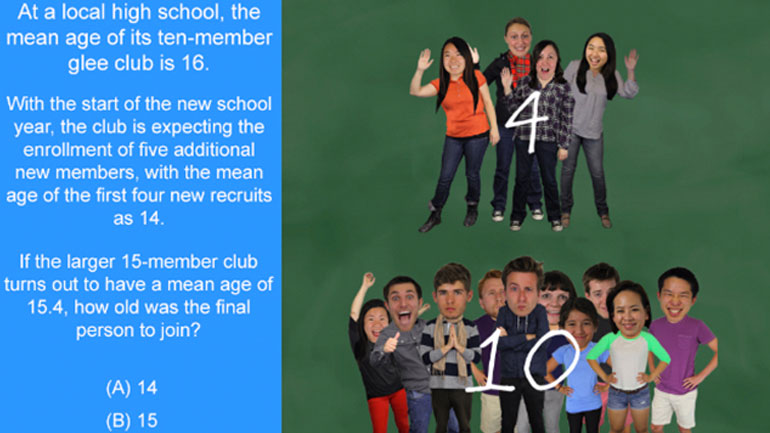
Statistics, Data, and Probability I: Drill Set 1, Problem 4. How old was the final person to join?