ShmoopTube
Where Monty Python meets your 10th grade teacher.
Search Thousands of Shmoop Videos
Math Videos 43 videos
Want to start your own business one day? Then this video is a must-watch. If you're just planning to keep working at Wendy's forever, then move along.
If you know your earnings, and you know how much you've spent, how do you calculate your profit? That's right - you hire an accountant. (Or, if you...
Math 5: Adjusting Profit Values 2 Views
Share It!
Description:
Let's watch Ben as he struggles with bar graphs. Why? Because we delight in the suffering of others, duh.
Transcript
- 00:02
[Dino and Coop singing]
- 00:12
Ooh, sweet bar graph!
- 00:14
We've seen a bunch of bar graphs in our time and that?
- 00:17
That's one to be proud of. [Boy holding up a bar graph grinning]
- 00:18
However, what if there's some sort of change in the data?
Full Transcript
- 00:21
You might have to make some adjustments.
- 00:23
But don't worry: it's not like bar graphs and written in stone. [Boy making adjustments to his graph]
- 00:27
And if you do make your bar graphs with stone, you should probably think of using something
- 00:31
else. [Bar graph written on a boulder and woman pushes it around]
- 00:32
Y'know…like… paper?
- 00:33
Just a thought.
- 00:35
Let's see how this works with an example.
- 00:37
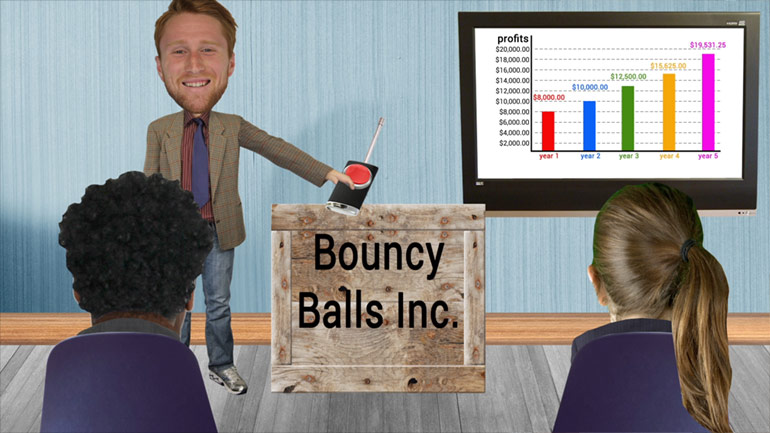
Ben works as an intern at Bouncy Balls Inc., a company that makes all sorts of bouncy balls. [Ben throwing a pink ball and catching it]
- 00:42
The hours aren't great, but he does get to take home as many bouncy balls as he wants,
- 00:47
so…we'd call that a win.
- 00:49
For one project, he had to make a bar graph, showing projections of the company's profits [Profit projections for Ben's company]
- 00:53
for the next five years.
- 00:54
Based on the info he got, it seemed like profits would be up a quarter every year.
- 00:59
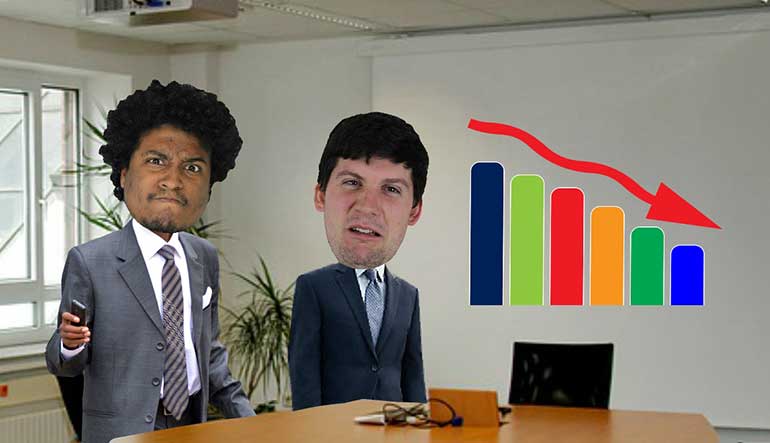
However, it turns out the company is actually expecting a drop in profits of one fifth in [Man holds out a sign for a drop in profit in year 3 and Ben gasps]
- 01:05
year 3.
- 01:06
Does this mean Ben's graph will go in the trash…
- 01:08
…and that Ben might end up there, too? [Ben falls into a trash can]
- 01:10
Not necessarily…
- 01:11
Heh, just kidding, Ben.
- 01:13
You wouldn't fit in there anyway.
- 01:14
But Ben will definitely need to make some changes to his bar graph, so let's help him [Ben using a laptop to make changes to his bar graph]
- 01:18
out.
- 01:19
The change that Ben has to deal with is that rather than increasing by a quarter from year
- 01:23
2 to year 3…
- 01:24
…profits should actually drop by one fifth.
- 01:27
So let's take a look at those year 2 profits, and do some calculations. [Profit projections for Ben's company and arrow points to year 2]
- 01:31
If we look at the graph, we see that for year 2, profits were $10,000.
- 01:35
So let's multiply that by one fifth, and subtract the result from $10,000. [Year 2 profits multipled by 1 fifth]
- 01:39
We're sure you can do this calculation in your sleep, but we'd definitely recommend [Boy sleeping whilst doing math calculations]
- 01:43
doing most of your math while you're awake.
- 01:46
It's tough to see the paper when your eyes are closed. [Boy holding a scribbled piece of paper from writing while sleeping]
- 01:48
So, on to the calculations: one fifth times $10,000 is $2,000…
- 01:53
…and when we subtract that from the original $10,000, we get $8,000.
- 01:58
So once Ben adjusts his graph so that year 3 is at the right height, will he be done?
- 02:03
Nope. [Ben waves his arms in the air celebrating]
- 02:04
Sorry Benny, no rest for the wicked.
- 02:05
Remember, his graph was based on the idea that profits would go up by a quarter every
- 02:10
year… [Ben stops celebrating goes back to his graph]
- 02:11
…so after changing the bar for year 3, he also has to adjust all the years that came
- 02:14
after it: year 4 and year 5.
- 02:16
An intern's work is never done.
- 02:19
For year 4, we take the profits from year 3, multiply by a quarter…
- 02:22
…and then add this to the year 3 profits, giving us a total of $10,000.
- 02:27
For year 5, we do almost exactly the same thing, taking the profits from year 4, multiplying [Adjusted graph for the 5 year profit projections]
- 02:32
by a quarter…
- 02:33
…and then adding this to the year 4 profits, giving us a total of $12,500.
- 02:37
So once Ben adjusts the heights of his bars to hit this new data, he'll be ready to present [New adjusted bar graph and a hand giving a thumbs up]
- 02:41
his new bar graph.
- 02:43
And as long as he doesn't, say, knock over a huge crate of bouncy balls, the presentation
- 02:46
should go fine. [Ben knocks over a crate and bouncing balls fall out]
- 02:47
Ugh, Ben!
- 02:48
What'd we just say not to do??
- 02:51
This guy never listens. [Bouncing balls bouncing in the classroom]
Related Videos
Check out the best bias video ever made, courtesy of the most awesome and amazing educational website in existence.
No, this isn't a terrible new mint-peach bubble gum flavor...though it does tend to leave a bad taste in people's mouths.
Those settlers in Jamestown really should have settled down with all that land-stealing. Tobacco's bad for you anyway.
Being born out of multiple wars doesn't quite seem to fit the peaceful, polite Canadians we know and love today...oh wait, they were called The Bea...
Not every cartoon is meant to entertain small children while their mother gets some "Mommy time." There are also political cartoons, which are mean...

