ShmoopTube
Where Monty Python meets your 10th grade teacher.
Search Thousands of Shmoop Videos
Statistics and Probability Videos
Did they really have to make them all start with an M?
Interpret linear models Videos 5 videos


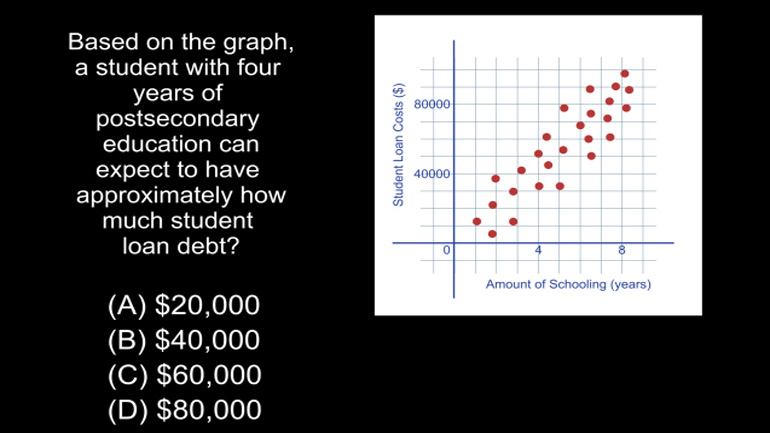
Statistics, Data, and Probability II Drill 4 Problem 4. Based on the graph, a student with four years of postsecondary education can expect to...
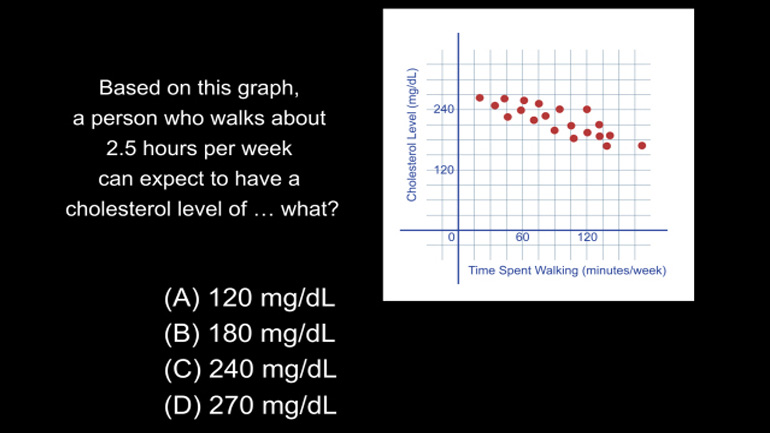
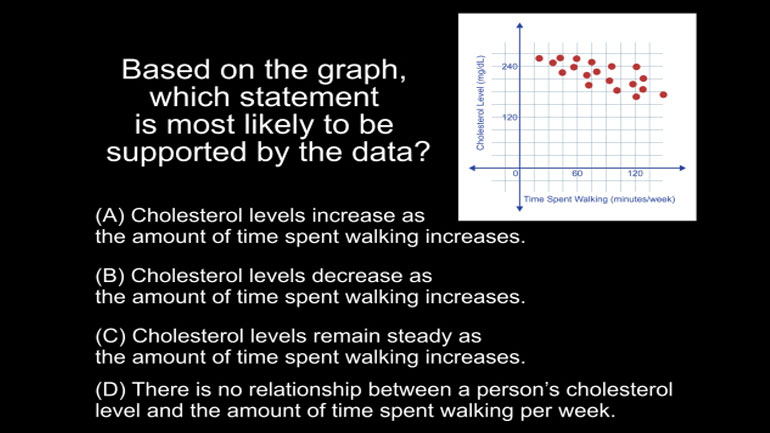
Statistics, Data, and Probability II Drill 4 Problem 3. Based on this graph, a person who walks about 2.5 hours per week can expect to have a...
Summarize, represent, and interpret data on a single variable Videos 5 videos


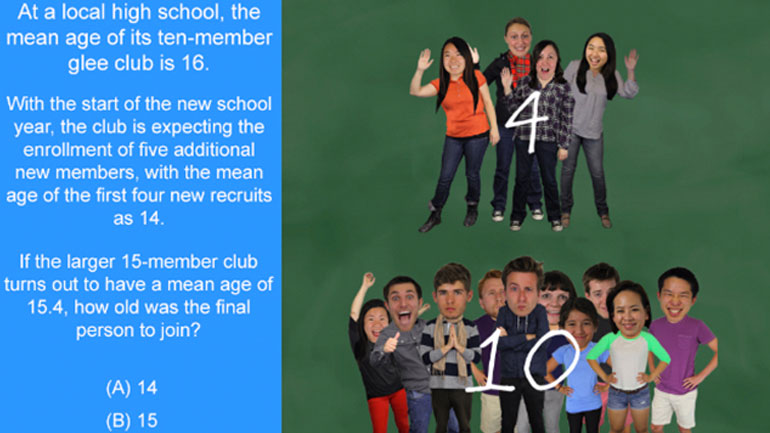
Statistics, Data, and Probability I: Drill Set 1, Problem 4. How old was the final person to join?

Data doesn't do us much good if we can't interpret it. Ever snuck into a CPA's office while he slips out for a coffee break and tried to decipher o...
Summarize, represent, and interpret data on two variables Videos 5 videos

Statistics, Data, and Probability II Drill 6 Problem 4. What conclusion can be drawn from the graph?

GED Math: Measurement Drill 2, Problem 2. 55% of consumers preferred paper in the year...what?