High School: Algebra

High School: Algebra

Reasoning with Equations and Inequalities HSA-REI.D.12

12. Graph the solutions to a linear inequality in two variables as a half-plane (excluding the boundary in the case of a strict inequality), and graph the solution set to a system of linear inequalities in two variables as the intersection of the corresponding half-planes.

All this is asking us to do is what we already know from the previous standards, plus one simple step. In fact, this step is fun (as long as you color inside the lines). Students should know how to graph a linear inequality, complete with all the nuts and bolts.

A linear inequality is the same as a linear equation, but instead of an equal sign, we'll have to use the inequality signs (like ≤, ≥, <, and >).

What's all this "half-plane" business? Just mathematical mumbo-jumbo. It means that because we're graphing an inequality and our linear equation is with a different sign now, it'll be shaded above or below the line as part of our solution. That's it.

When dealing with inequalities, your students should ask themselves two questions:

  1. Which part of the graph do I shade in?
  2. Do I draw a dotted or a solid line?

If the inequality is greater than or greater than or equal to (using either > or ≥), then we shade the upper half of the graph. If the inequality if less than or less than or equal to (using either < or ≤), then we shade the lower half of the graph.

If students are struggling with which half to shade, the simplest way to remove all doubt is to plug in the coordinates of a point that's very obviously on one side of the boundary. If the inequality is true for that point, then we know to shade the "half-plane" containing that point. If it's false, we'll shade in the other half. Make sure to bring your colored pencils.

The line that graphs our linear equation is dashed or dotted if we use greater than or less than (using > or <) in our inequality. That's so we know the line is a boundary, but all the points on it don't satisfy the inequality. The line we'll use is solid if the inequality has a greater than or equal to or less than or equal to (using ≥ or ≤) symbol because the boundary includes possible solutions to our inequality.

Students should understand how to graph not one, but two inequalities. It's just like graphing one inequality, and then graphing another right on top of it. Using the same graph saves trees.

Given a pair of inequalities (such as y < x – 5 and yx – 6, for instance), we draw them as though they were equations first. We can do this through a computer, a graphing calculator, or by creating a table of values to calculate enough points to get us a straight line.

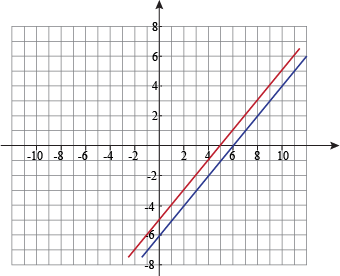
Time to bust out those colored pencils. Since our first inequality is "less than," this means we must shade below the line. We'll color it red. Then comes the ultimate question: solid or dotted? Well, there's no "equal to" component, so our set of solutions to the inequality does not include the boundary line itself. That means it must be drawn as a dotted line.

For the second inequality, we know that it must be "greater than or equal to," meaning we shade above the line. We'll pick blue. Because of its " equal to" part, we must include the line. It must remain solid.

Red and blue make purple. The overlapping purple area is the solution to our system of inequalities. That means that only within the overlapping area will the values of x and y work for both the inequalities we listed.

Students should know how to graph inequalities, shade in the half-planes, and find the set of solutions for a system of inequalities. If students are struggling, have them plug in coordinates that are on the boundary or very clearly to one side. This will help connect the graph and the inequality, as well as make sense of what's going algebraically and graphically.

Also, make sure they pick colors that go together.


Drills

  1. Do the two inequalities y > x2 – 2 and y < -x2 + 2 overlap?

    Correct Answer:

    Yes, they overlap

    Answer Explanation:

    If we graph our inequalities (a graphing calculator works just fine), we should end up with something that looks like this.

    There's very clearly an overlap, but just to double-check, we can plug in the point (0, 0). If we do so, we get 0 > 02 – 2 and 0 < -02 + 2. In other words, 0 > -2 and 0 < 2, both of which are true.


  2. A health inspector has been plotting data concerning some particularly nasty well water. He has three inequalities, one for each local town. The overlapping area on his graph shows where the worst well water is. If the three inequalities are y > x + 7, y > -x + 6, and y < 7, what are the x values for the locations where the well water is worst?

    Correct Answer:

    Where x is between -1 and 0

    Answer Explanation:

    We can see after graphing our inequalities that the three areas overlap in a very specific triangle area, approximately between -1 and 0 on the x-axis. If we plug in -0.5 for x, we can see that this turns the inequalities into y < 7, y > 6.5, and y > 6.5. With a value of y between 6.5 and 7, this is possible.


  3. The budgets of two companies are projected to be linear inequalities. Each CEO has come to you personally (but separately since they don't want the other one to know) to figure out where the points of overlap are for these two budgets. The two inequalities are yx and y ≥ -0.5x + 8. If x represents days, after how many days will their budgets begin to overlap?

    Correct Answer:

    In less than 6 days

    Answer Explanation:

    If we graph and shade in the two inequalities, we'll see that the shaded regions begin only after x = 5. If we plug in x = 6, we'll have the inequalities y ≤ 6 and y ≥ 5, so any value from 5 to 6 would work. That means the budgets have definitely overlapped by day 6.


  4. The principal has found out that students who listen to their math teacher have GPAs modeled by the inequality y < x + 9, while the GPAs of students who don't are given by y > x + 9. He wants you to create a little poster, since it's much better to visually see the data, in a graphical form. Draw you graph below and tell him at which point (x) the graphs overlap.

    Correct Answer:

    They do not overlap

    Answer Explanation:

    The only difference between the two inequalities is the "greater than" or "less than" sign. That means they have the same boundary, but are shaded in opposite directions. If they contained an "equal to" component, they would overlap at y = x + 9, but they don't, so these graphs do not overlap. How sad.


  5. The local baseball maker needs to know how many baseballs your team will need this season (since you hit them so hard they often break apart and need to be frequently replaced). He's modeled that you'll need yx + 14 baseballs over the next x months. How many baseballs (y) will you need in one year?

    Correct Answer:

    All of the above

    Answer Explanation:

    We'll assume that in one year, x = 12 (there are 12 months in a year, right?). It's important to remember what an inequality is, too. You'll need anywhere from 0 to 26 baseballs by the twelfth month. Just because the boundary line stops at 26 doesn't mean that's the only option. After all, 20, 24, and 26 all work for y ≤ 26.


  6. Is the point (3, 7) is included in the inequality y ≥ ⅓x3?

    Correct Answer:

    No, it's not within the shaded area

    Answer Explanation:

    We could use a graphing calculator to find draw the inequality, or we could just plug in the point and see if the inequality holds true. If we plug it in, we should get , which isn't true. That means (B) is the right answer. If we need visual proof of this, we can graph the inequality and we'll end up with this.


  7. Which of the following points are valid for the inequality y > πx?

    Correct Answer:

    All of the above

    Answer Explanation:

    The simplest method is to plug in the coordinates for the x and y values. While graphs may help visually (and in many cases, they're very useful), it all comes down to the numbers. Every coordinate listed works with the inequality (4 > 0.78, 2 > 1.05, and -1 > -1.05), so the correct answer is (D). Graphed on the coordinate plane, the inequality looks like this.


  8. When an inequality has a symbol that represents "greater than or equal to," the inequality must be drawn with…

    Correct Answer:

    a solid line.

    Answer Explanation:

    The "equal to" portion of the inequality is actually an equality (no "in"). Since we draw linear equations with solid lines, we should give the same courtesy to inequalities that incorporate equalities. How would we denote the boundary if (C) was right, and how would we draw a straight line if (D) was right?


  9. When graphing an inequality that says "less than," we must shade in which portion of the graph?

    Correct Answer:

    Everything down and low

    Answer Explanation:

    The "less than" symbol means we have to shade everything below the line. Since sometimes it might not be clear what "below" is, plugging in a point and working out the math is usually pretty helpful.


  10. A system of inequalities can be solved by graphing the inequalities. But where are the solutions?

    Correct Answer:

    In the shaded areas that overlap

    Answer Explanation:

    The solution for two or more inequalities lies where the inequalities' shaded areas overlap. The boundaries aren't always the solutions themselves, and the whole reason we shade the graphs is to indicate the possible solutions. The solutions for a system of inequalities would need to be in the overlapping shaded areas.