ShmoopTube
Where Monty Python meets your 10th grade teacher.
Search Thousands of Shmoop Videos
English I EOC Assessment Videos 175 videos


AP® English Language and Composition: Comprehension Drill 1, Problem 1. The speaker would agree with all of the following statements except what?

AP English Language and Composition: Comprehension Drill 1, Problem 3. What can the "personality" that the speaker describes be characterized as?
AP English Language and Composition: Comprehension 1.9
ACT Science 1.10 Data Representation Passage 276 Views
Share It!
Description:
ACT Science: Data Representation Passage Drill 1, Problem 10. What do the statistics in Figure 1 suggest?
Transcript
- 00:03
Here's your shmoop du jour, brought to you by ballpark franks!
- 00:08
Not you Bob, not you Steve! Just Frank.
- 00:11
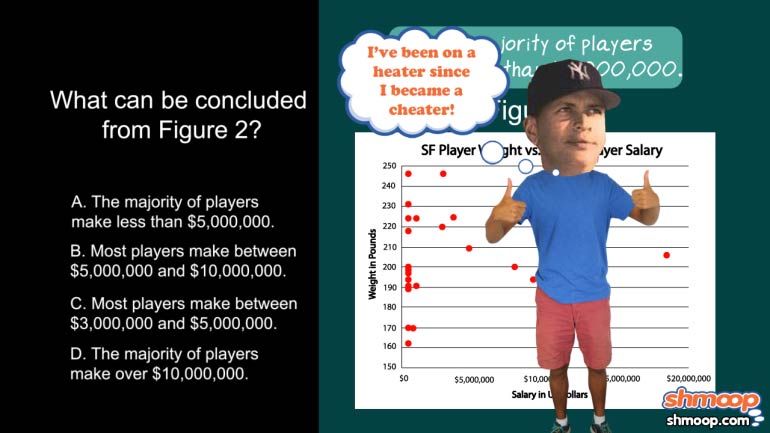
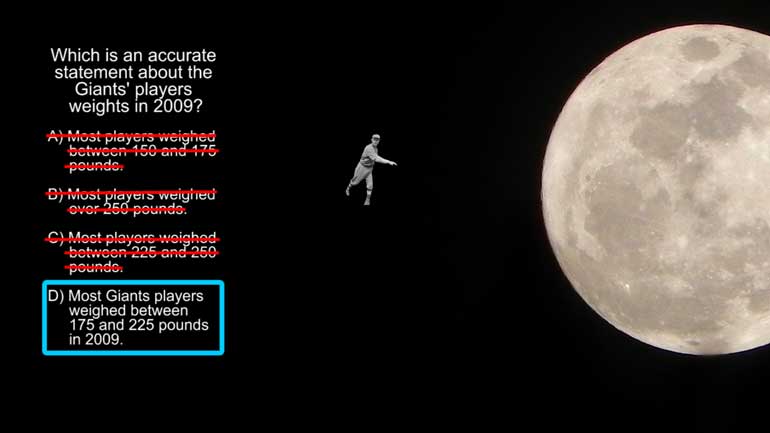
Figure 1 supports the idea that: what?
- 00:14
And here are the potential answers:
- 00:20
This question is asking us about Figure 1. Let's look through the statements to find the right idea.
Full Transcript
- 00:26
Answer A. An MLB star can make more than 4 million bucks
- 00:30
Well, although the salaries plotted on the graph never reach $4,000,000, keep
- 00:34
in mind that the graph is showing AVERAGE salaries.
- 00:37
So this is definitely supported by Figure 1.
- 00:39
Just to be sure, let's check the other statements. Answer B says the exact opposite of A.
- 00:45
so it's not supported. Statement C: an MLB player makes less today than 30 years ago.
- 00:52
Just by looking at the graph, we can see that the average salary has significantly increased,
- 00:56
so this isn't supported either. Answer D says that 1995 was the best year for salaries.
- 01:02
But again, the average salaries have SIGNIFICANTLY increased overtime, so
- 01:06
1995 isn't the best year. The answer is A.
Related Videos
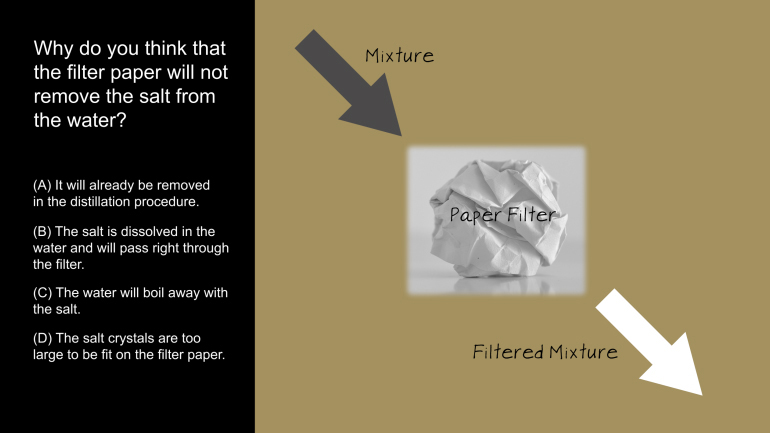
ACT Science: Research Summary Passage Drill 2, Problem 1. Why do you think that the filter paper will not remove the salt from the water?
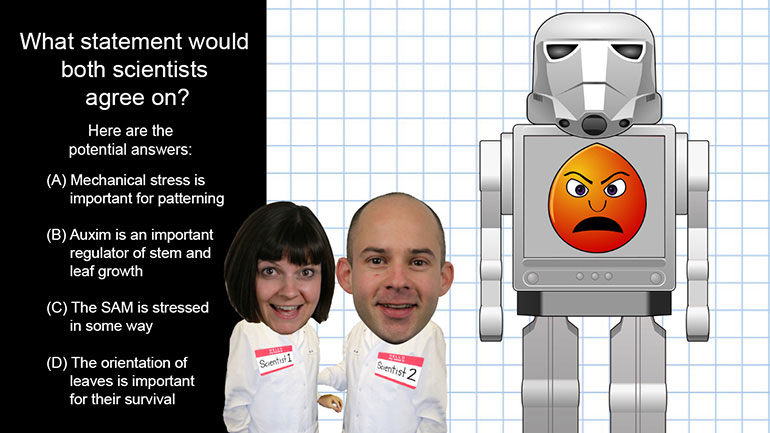
ACT Science: Conflicting Viewpoint Passage Drill 1, Problem 1. What statement would both scientists agree upon?

ACT Science: Data Representation Passage Drill 1, Problem 1. What do the statistics in Figure 1 suggest?

ACT Science: Data Representation Passage Drill 1, Problem 2. Which of the following is a variable in Figure 1, but not in Figure 2?
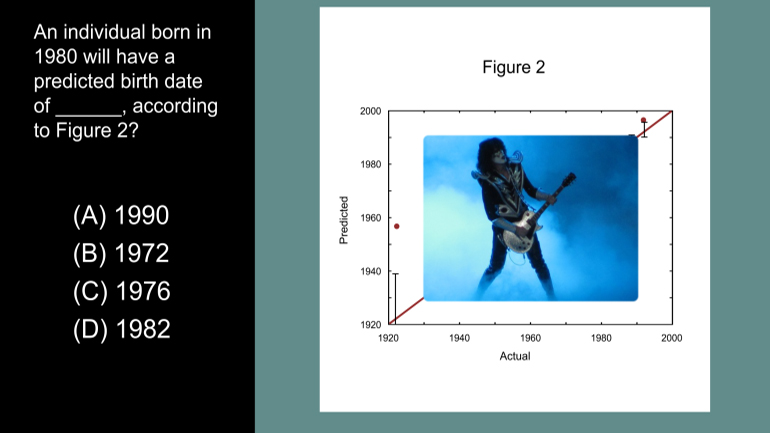
ACT Science Data Representation Passage: Drill 3, Problem 5. According to Figure 2, what birth date will be predicted for an individual actual...